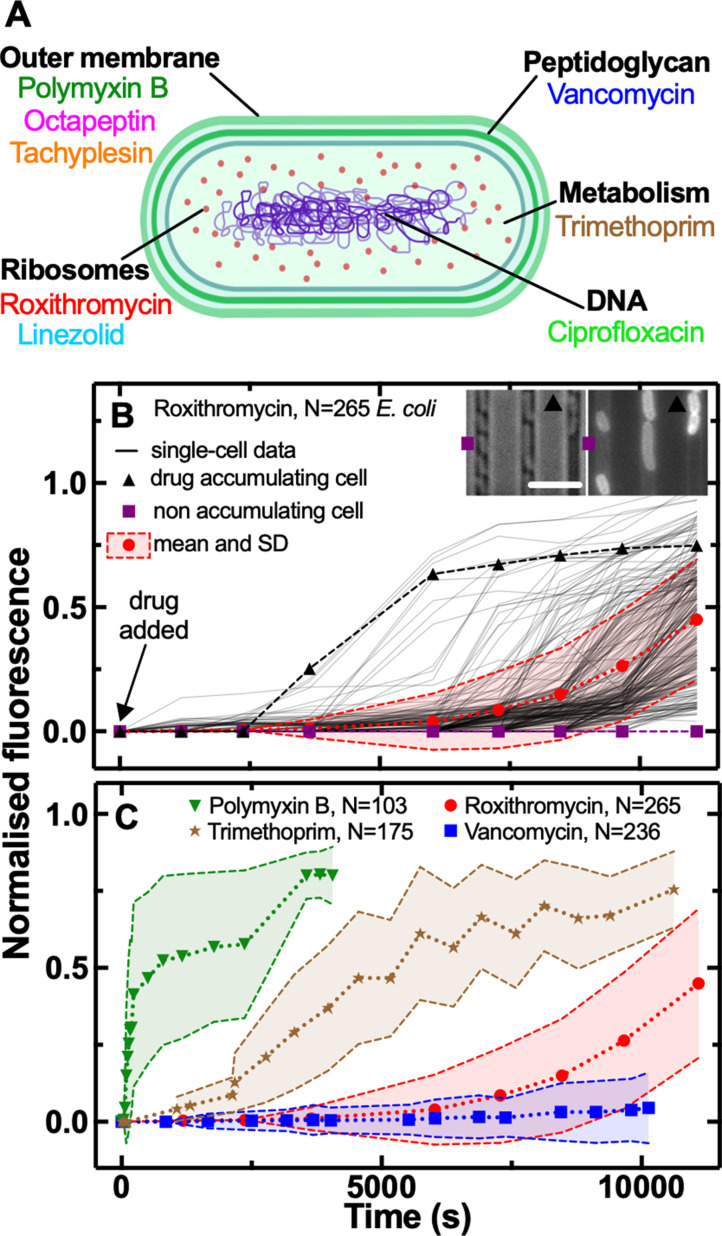
Figure 1. Phenotypic heterogeneity in the accumulation of the major classes of antibiotics.
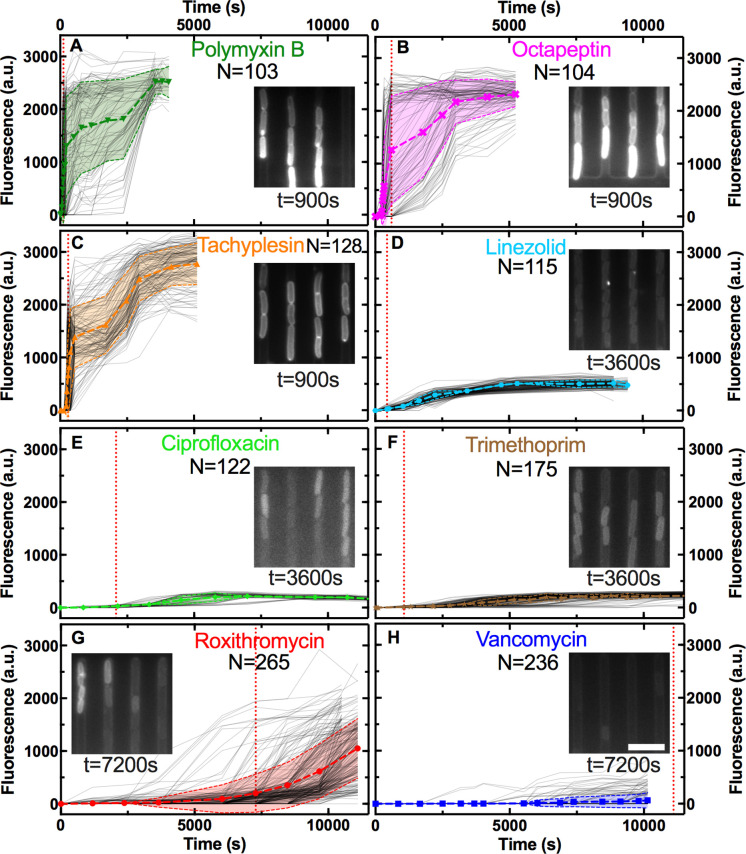
(A) Illustration depicting the eight antibiotics employed in this study alongside their bacterial targets. (B) Accumulation of the fluorescent derivative of roxithromycin in 265 individual E. coli (continuous lines) after adding the probe at 46 µg mL–1 extracellular concentration in M9 minimal medium from t=0 onwards. Fluorescence values were background subtracted and normalised first by cell size and then to the maximum value in the dataset (see Methods). The circles and shaded areas represent the mean and SD of the values from 265 bacteria collated from biological triplicate. The squares represent the fluorescent values of a representative bacterium that does not accumulate the fluorescent derivative of roxithromycin, whereas the triangles represent the fluorescent values of a representative bacterium that accumulates the drug. Insets: representative brightfield and fluorescence images after 7000 s incubation in the fluorescent derivative of roxithromycin, the symbols indicate the two representative bacteria above. Scale bar: 5 µm. (C) Population average (symbols) and SD (shaded areas) of the accumulation of the fluorescent derivatives of polymyxin B (triangles), trimethoprim (stars), roxithromycin (circles), and vancomycin (squares) probes added at 46 µg mL–1 extracellular concentration in M9 minimal medium from t=0 onwards. Data are obtained by averaging at least one hundred single-cell values (i.e. N=103, 175, 265, and 236, respectively) collated from biological triplicate. Corresponding single-cell data along with data for the fluorescent derivatives of linezolid, tachyplesin, octapeptin, and ciprofloxacin probes are reported in Figure 1—figure supplement 2.
Figure 1—figure supplement 1. Measurement of single-cell elongation rates.
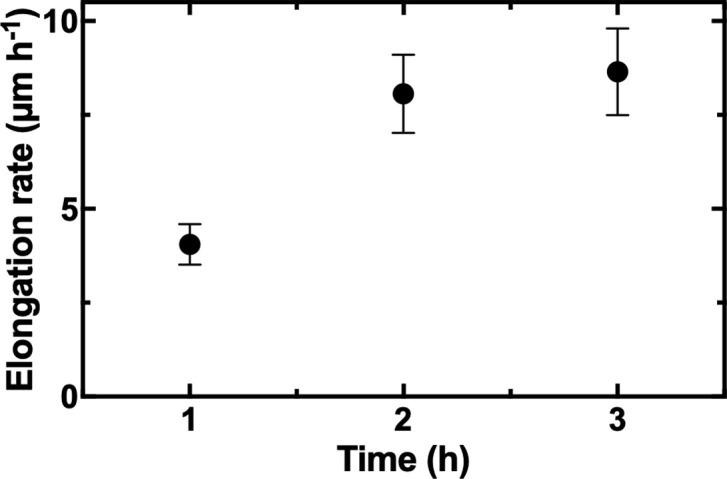
Figure 1—figure supplement 2. Measurement of single-cell drug accumulation.
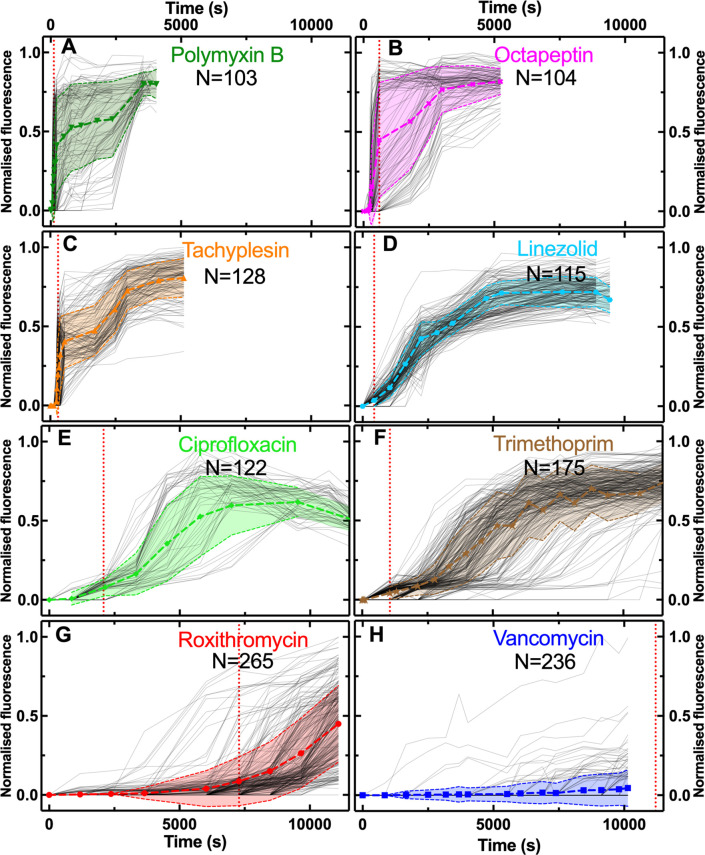
Figure 1—figure supplement 3. Measurement of normalised single-cell drug accumulation.
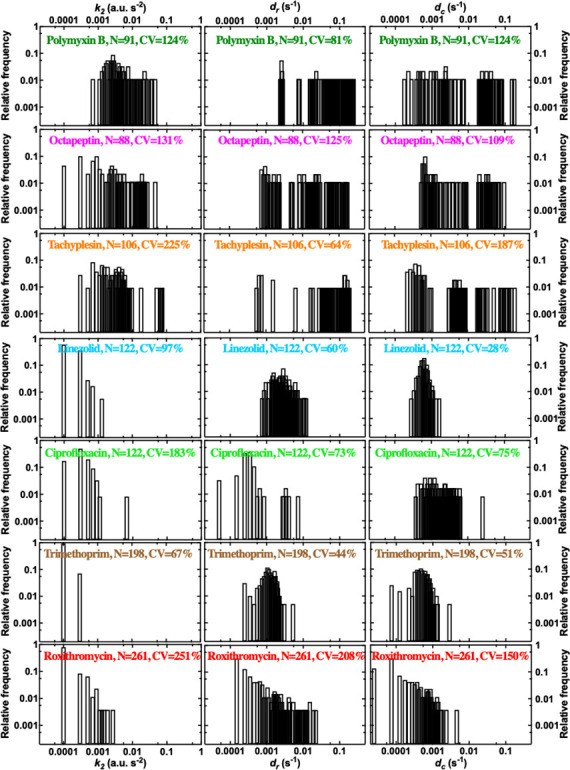
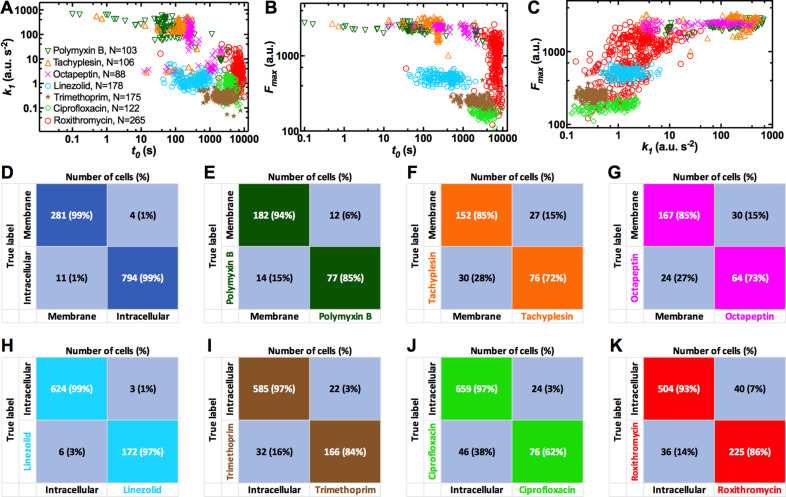
Figure 1—figure supplement 4. Heterogeneity in the accumulation of different antibiotics.
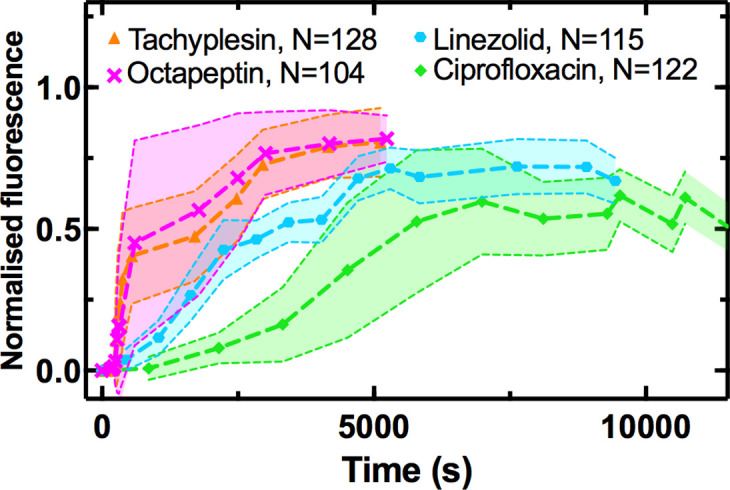
Figure 1—figure supplement 5. Measurement of single-cell doubling times.
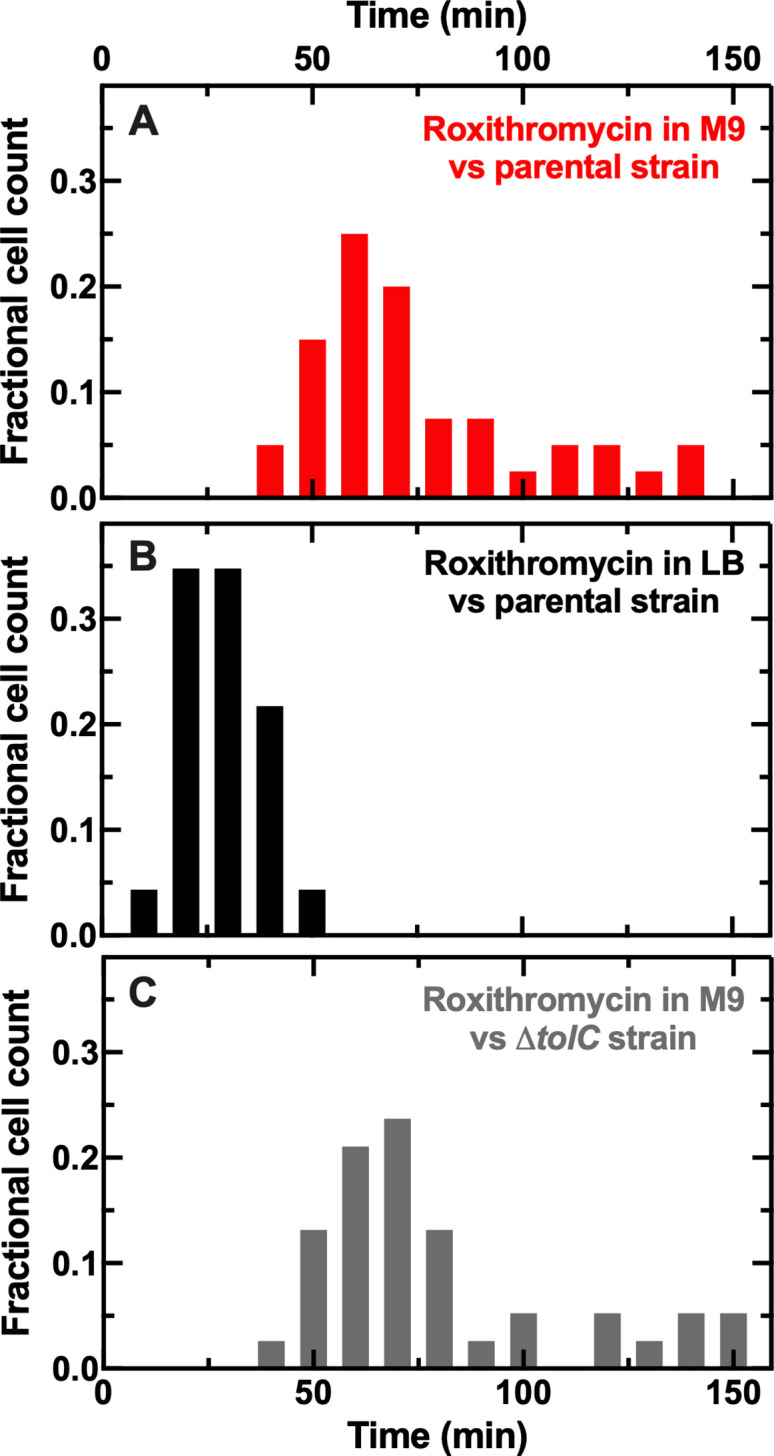
Figure 1—figure supplement 6. Interdependence between cell size and drug accumulation.
Figure 1—figure supplement 7. Staining of bacteria with different antibiotics.
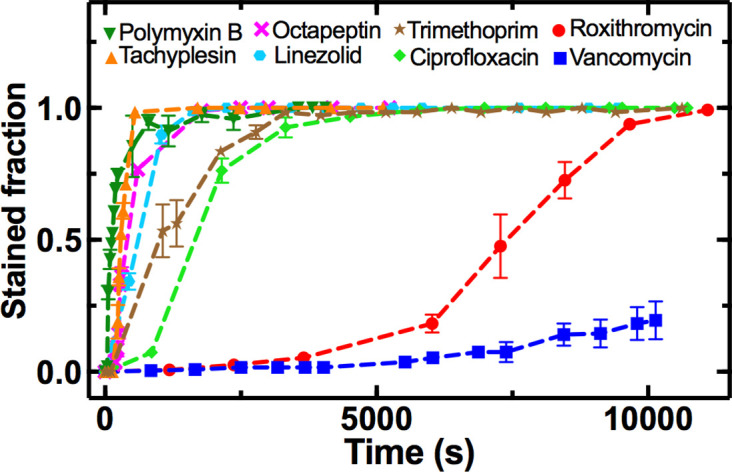
Figure 1—figure supplement 8. Comparison of single-cell roxithromycin accumulation in E. coli and S. aureus.
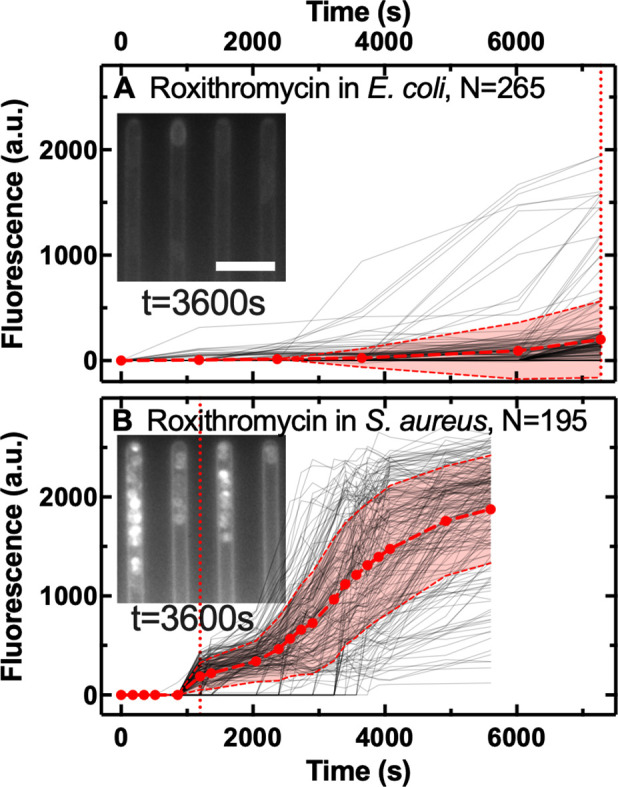
Figure 1—figure supplement 9. Comparison of single-cell vancomycin accumulation in E. coli and S. aureus.
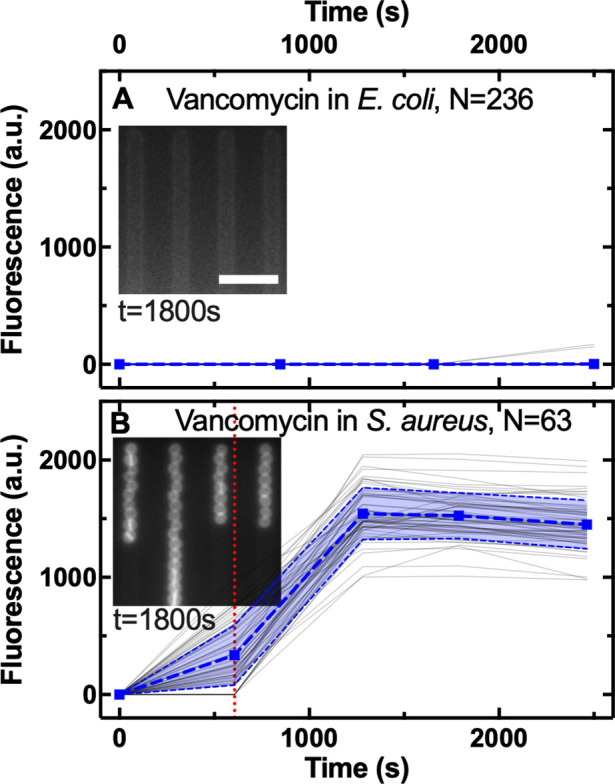
Figure 1—figure supplement 10. Comparison of single-cell ciprofloxacin accumulation in E. coli, P. aeruginosa, and B. cenocepacia.
Figure 1—figure supplement 11. Impact of drug milieu and concentration on drug accumulation.
Figure 1—figure supplement 12. Impact of drug labelling on drug accumulation.
Figure 1—figure supplement 13. Main single-cell kinetic parameters inferred using our mathematical model.
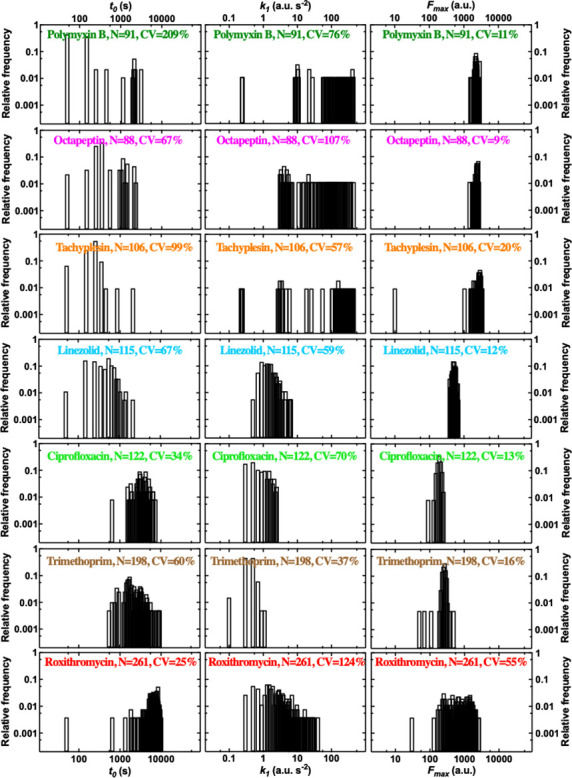
Figure 1—figure supplement 14. Second order single-cell kinetic parameters inferred using our mathematical model.
