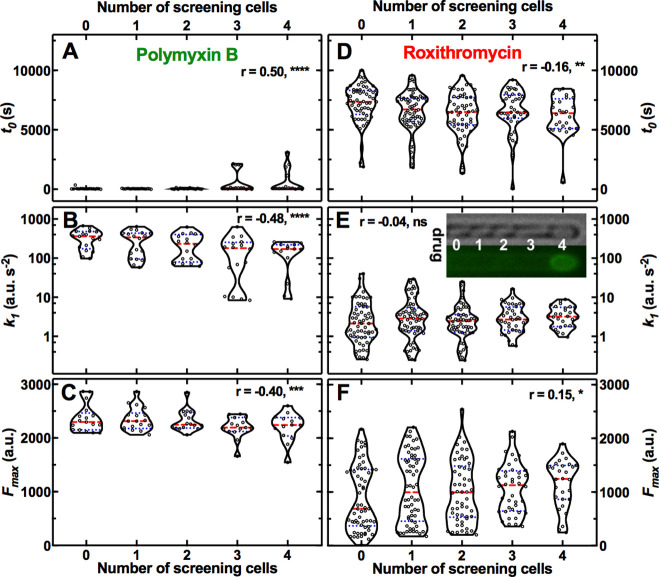
Figure 3. Effect of the presence of screening cells on the accumulation of antibiotics in single cells.
Dependence of the kinetic parameters t0, k1, and Fmax for the accumulation of fluorescent derivatives of polymyxin B (A–C) and roxithromycin (D–F) on the number of screening cells between the bacterium under investigation and the main microfluidic chamber where the drug is continuously injected. Each data point is the value of a kinetic parameter inferred for an individual bacterium from the data in Figure 1—figure supplement 2 using our mathematical model, N=103 and 265 for polymyxin B and roxithromycin, respectively. The red dashed and blue dotted lines within each violin plot represent the median and quartiles of each data set, respectively. r is the Pearson coefficient quantifying the correlation between each inferred kinetic parameter and the number of screening cells in front of each bacterium. ns: not significant correlation, *: p-value<0.05, **: p-value<0.01, ***: p-value<0.001, ****: p-value<0.0001. Inset: representative brightfield and fluorescence images illustrating, from left to right, a bacterium screened by 0, 1, 2, 3, and 4 cells, respectively; roxithromycin-NBD was injected in the main microfluidic chamber in the left-hand side of the image and diffused from left to right. The fluorescence image shows early roxithromycin-NBD accumulation in the bacterium screened by the highest number of cells.


