. 2022 Jun 7;11:e74062. doi: 10.7554/eLife.74062

Figure 4. Differential cell growth and expression of key molecular pathways prior antibiotic treatment contributes to heterogeneity in roxithromycin accumulation.

(A–C) Correlation between the single-cell kinetic parameters t0, k1 and Fmax describing the accumulation of roxithromycin-NBD and the bacterial elongation rate during the 2 hr growth period preceding antibiotic treatment (see Methods). Measurements were carried out on N=50 individual E. coli, collated from biological triplicate, before and after exposure to 192 µg mL–1 roxithromycin-NBD dissolved in M9. (D–F) Correlation between single-cell green fluorescent protein (GFP) fluorescence, as a proxy for the expression of tolC, ompC, and rrnB promoters, and single-cell kinetic parameters t0, k1 and Fmax describing the accumulation of roxithromycin-DMACA (at an extracellular concentration of 192 µg mL–1). r is the Pearson coefficient quantifying the correlation between each inferred kinetic parameter and the corresponding elongation rate of each cell. ns: not significant correlation, **: p-value<0.01, ***: p-value<0.001, ****: p-value<0.0001. Dashed lines are linear regressions to the data. Measurements were carried out on N=34, 30, and 33 individual E. coli collated from biological triplicate for the tolC, ompC, and rrnB reporter strains, respectively.

Figure 4—source data 1. Correlation between octapeptin accumulation and cell growth state.
Interdependence between single-cell elongation rate before treatment and the onset t0, the rate k1, and the saturation Fmax in the accumulation of the fluorescent derivative of octapeptin.
Figure 4—source data 2. Correlation between tachyplesin accumulation and cell growth state.
Interdependence between single-cell elongation rate before treatment and the onset t0, the rate k1, and the saturation Fmax in the accumulation of the fluorescent derivative of tachyplesin.
Figure 4—source data 3. Correlation between trimethoprim accumulation and cell growth state.
Interdependence between single-cell elongation rate before treatment and the onset t0, the rate k1, and the saturation Fmax in the accumulation of the fluorescent derivative of trimethoprim.
Figure 4—source data 4. Correlation between roxithromycin accumulation and cell growth state.
Interdependence between single-cell elongation rate before treatment and the onset t0, the rate k1, and the saturation Fmax in the accumulation of the fluorescent derivative of roxithromycin.
Figure 4—source data 5. Correlation between the expression of tolC and roxithromycin accumulation.
Correlation between single-cell GFP fluorescence, as a proxy for the expression of tolC promoter and the single-cell kinetic parameter t0 describing the onset in the accumulation of roxithromycin-DMACA (at an extracellular concentration of 192 µg mL–1).
Figure 4—source data 6. Correlation between the expression of ompC and roxithromycin accumulation.
Correlation between single-cell GFP fluorescence, as a proxy for the expression of ompC promoter and the single-cell kinetic parameter k1 describing the rate of uptake in the accumulation of roxithromycin-DMACA (at an extracellular concentration of 192 µg mL–1).
Figure 4—source data 7. Correlation between the expression of rrnB and roxithromycin accumulation.
Correlation between single-cell GFP fluorescence, as a proxy for the expression of rrnB promoter and the single-cell kinetic parameter Fmax describing the saturation level in the accumulation of roxithromycin-DMACA (at an extracellular concentration of 192 µg mL–1).
Figure 4—source data 8. Correlation between the expression of rrnH and roxithromycin accumulation.
Correlation between single-cell GFP fluorescence, as a proxy for the expression of rrnH promoter, and the single-cell kinetic parameter Fmax describing the saturation level in the accumulation of roxithromycin-DMACA (at an extracellular concentration of 192 µg mL–1).

Figure 4.

Figure 4—figure supplement 1. Correlation between drug accumulation and cell growth state.

Figure 4—figure supplement 1.

Interdependence between single-cell elongation rate before treatment and the onset t0, the rate k1, and the saturation Fmax in the accumulation of fluorescent derivatives of (A–C) octapeptin, (D–F) tachyplesin, and (G–I) trimethoprim, respectively. r is the Pearson correlation coefficient, **: p-value<0.01, ns: not significant, p-value>0.05. N=28, 27, and 61 individual E. coli investigated for the accumulation of the fluorescent derivatives of octapeptin, tachyplesin, and trimethoprim, respectively, and collated from biological triplicate. In each experiment E. coli were grown for 2 hr in the microfluidic device with continuous supply of fresh lysogeny broth (LB). During this 2 hr growth period the elongation rate of each bacterium was measured between consecutive time points and the average elongation rate for each bacterium was calculated. At the end of this 2 hr growth period, one of the three fluorescent antibiotic derivatives above was continuously delivered for a 4 hr treatment period in the microfluidic device at a concentration of 46 µg mL–1 in M9 minimal medium. During this 4 hr treatment period single-cell fluorescence data were obtained and dynamic accumulation parameters t0, k1 and Fmax were inferred by fitting these single-cell data to our mathematical model (see Methods).
Figure 4—figure supplement 2. Differential cell growth contributes to heterogeneity in roxithromycin accumulation.

Figure 4—figure supplement 2.

Correlation between the single-cell kinetic parameters t0, k1 and Fmax describing the accumulation of roxithromycin-NBD and the bacterial elongation rate during the 2 hr growth period preceding antibiotic treatment for (A–C) non-dividing bacteria, (D–F) bacteria that divided once, (G–I) bacteria that divided twice during the 2 hr growth period preceding antibiotic treatment. Data are reproduced from Figure 4A–C.
Figure 4—figure supplement 3. Distribution of single-cell elongation rates during roxithromycin treatment.

Figure 4—figure supplement 3.

Circles are single E. coli cell elongation rates averaged over the duration of treatment with 192 µg mL–1 roxithromycin-NBD dissolved in M9. Measurements were carried out on N=50 individual E. coli, collated from biological triplicate. The red line and blue dotted lines within each violin plot represent the median and quartiles of each data set, respectively.
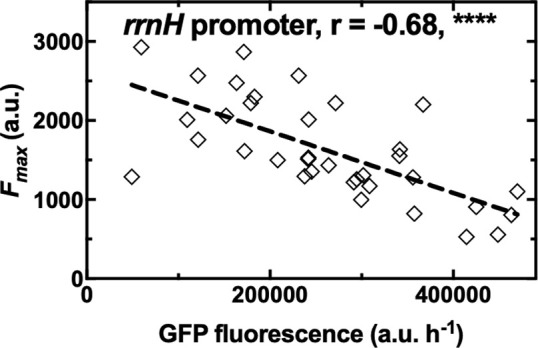
Figure 4—figure supplement 4. Negative correlation between ribosomal expression and roxithromycin accumulation.

Figure 4—figure supplement 4.

Correlation between the single-cell kinetic parameter Fmax describing the accumulation of roxithromycin-DMACA (at an extracellular concentration of 192 µg mL–1) and the single-cell GFP fluorescence as a proxy for the expression of rrnH promoter. r is the Pearson coefficient, ****: p-value<0.0001. The dashed line is a linear regression to the data. Measurements were carried out on N=35 individual E. coli collated from biological triplicate.