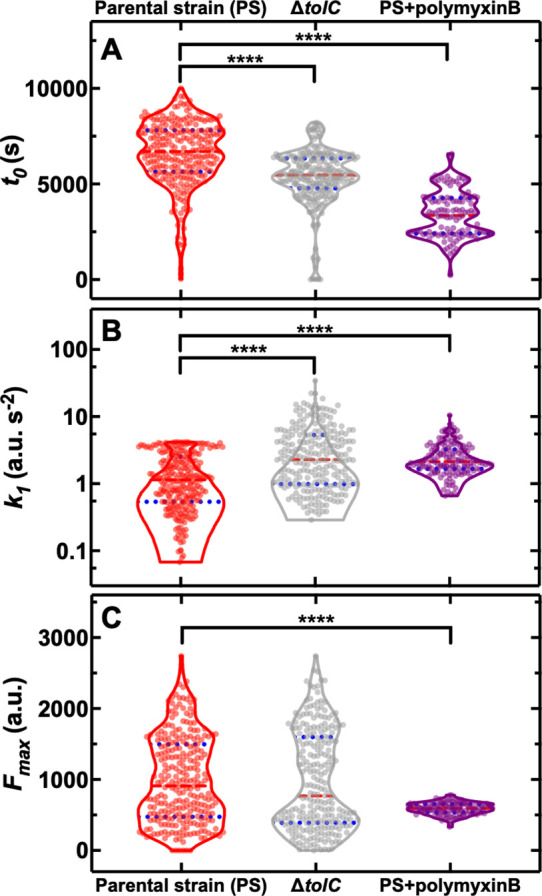
Figure 5. Genetic and chemical manipulation of heterogeneity in drug accumulation.
Distributions of single-cell values for the kinetic parameters (A) t0, (B) k1 and (C) Fmax describing the accumulation of the fluorescent derivative of roxithromycin (at 46 µg mL–1 in M9) in the E. coli BW25113 parental strain (PS), the knockout mutant ΔtolC and the parental strain co-treated with unlabelled polymyxin B at 1 µg mL–1 extracellular concentration. The red dashed and blue dotted lines within each violin plot represent the median and quartiles of each data set, respectively. ****: p-value<0.0001. N=262, 241, and 116 individual parental strain E. coli treated with the roxithromycin probe, ΔtolC E. coli treated with the roxithromycin probe and parental strain E. coli co-treated with the roxithromycin probe and 1 µg mL–1 unlabelled polymyxin B.

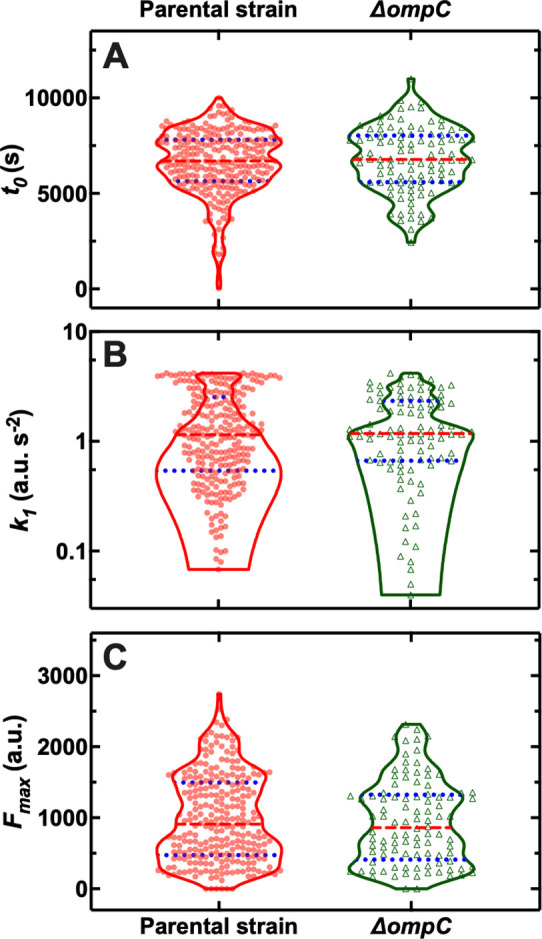
Figure 5—figure supplement 1. Distributions of single-cell values for the kinetic parameters (A) t0, (B) k1 and (C) Fmax describing the accumulation of the fluorescent derivative of roxithromycin (at 46 µg mL–1 in M9) in the E. coli BW25113 parental strain and the knockout mutant ΔompC. The red dashed and blue dotted lines within each violin plot represent the median and quartiles of each data set, respectively. None of the kinetic parameters was significantly different in the knockout mutant ΔompC compared to the parental strain, p-values of 0.39, 0.69, and 0.41, respectively. N=262 and 100 individual bacteria for the parental and ΔompC strain, respectively.

