. 2022 May 26;11:e75663. doi: 10.7554/eLife.75663

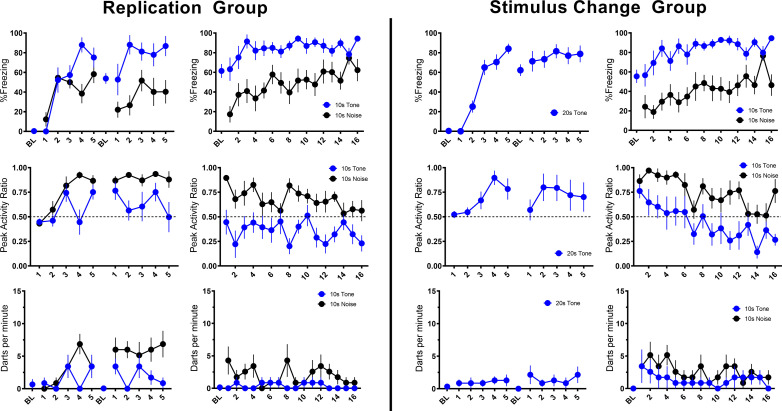
Figure 2. Trial-by-trial mean (±SEM) percent freezing, peak activity ratio, and darts per minute throughout all stimulus presentations during training (left panels) and testing (right panels) for the Replication Group (n=7; left half of figure) and the Stimulus Change Group (n=7; right half of figure) in Experiment 1.

See Figure 2—source data 1 & Figure 2—source data 2.

Figure 2—source data 1. Source files for freezing, PAR, and darting for Experiment 1-Replication and Stimulus Change groups.
Figure 2—source data 2. Source files for velocity for all of Experiment 1.

Figure 2.

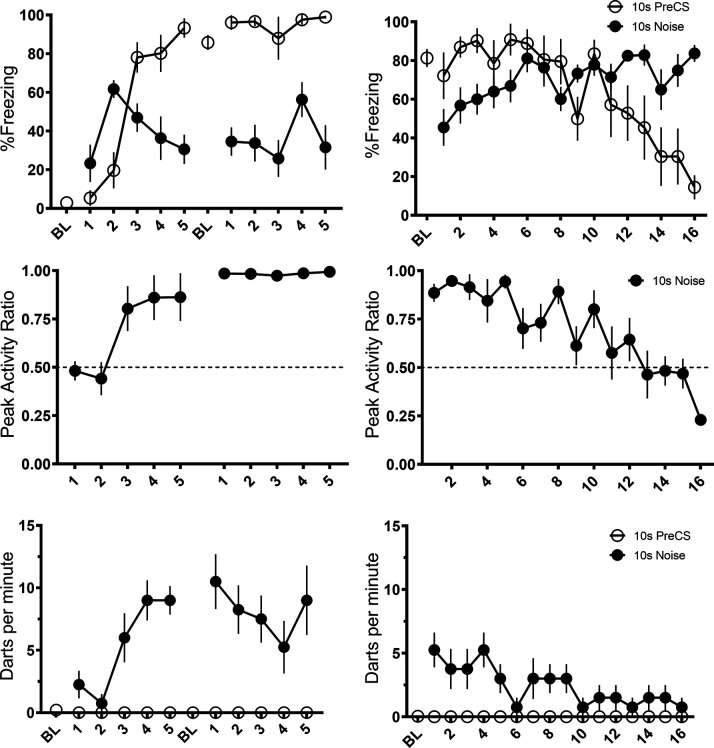
Figure 2—figure supplement 1. Mean (±SEM) percent freezing, peak activity ratio, and darts per minute throughout training (left panels) and testing (right panels) for the CS Duration Group (n=8) of Experiment 1.

Figure 2—figure supplement 1.

Responding during the 10 s preCS period is represented with open circles, responding during the noise is represented with filled in black circles. See Figure 2—figure supplement 1—source data 1.
Figure 2—figure supplement 1—source data 1. Source files for freezing, PAR, and darting for Experiment 1-CS Duration group.