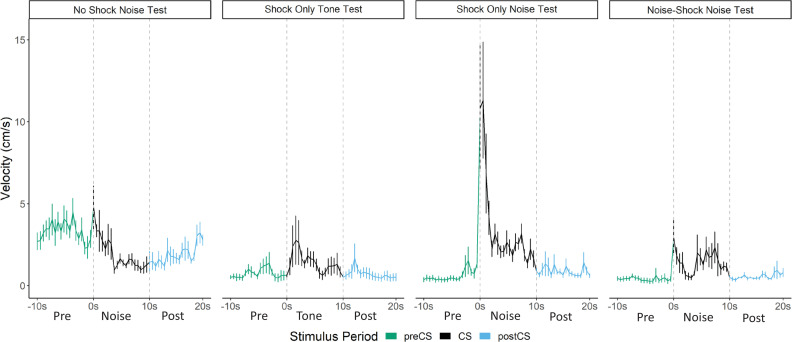
Figure 5. Averaged traces of velocity (cm/s) across the first four trials of extinction during testing for Experiment 2 (n=8 per group).
Data were averaged across all animals per group and binned into ~0.5 s bins (0.533 s) and presented as mean ± SE. These within-subject error bars are corrected for between-subject variability using methods as described in Morey, 2008. During this test, the no shock-noise test, shock only-noise test, and noise-shock noise test groups were tested with a 10 s noise. The shock only-tone test group was tested with a 10 s tone. See Figure 5—source data 1.

