. 2022 May 26;11:e75663. doi: 10.7554/eLife.75663

Figure 8. Averaged traces of velocity (cm/s) across three trials of extinction during testing for Experiment 4 (n=8 per group).

Datawere averaged across all animals per group and binned into ~0.5 s bins (0.533 s) and presented as mean ± SE. These within-subject error bars are corrected for between-subject variability using methods as described in Morey, 2008. During this test, all groups were tested with a 10 s noise CS. See Figure 8—source data 1.

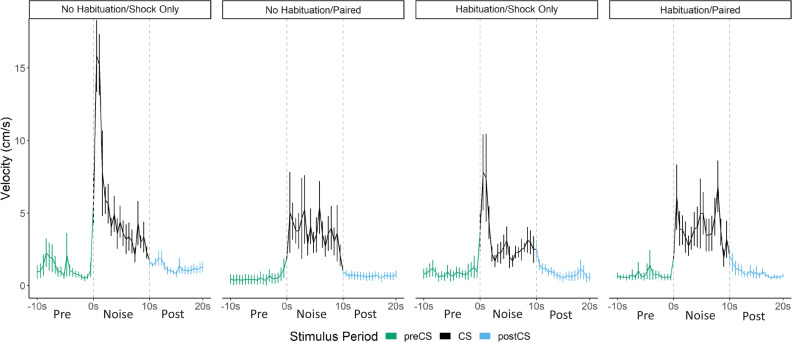
Figure 8—source data 1. Source files for velocity on test day of Experiment 4.

Figure 8.

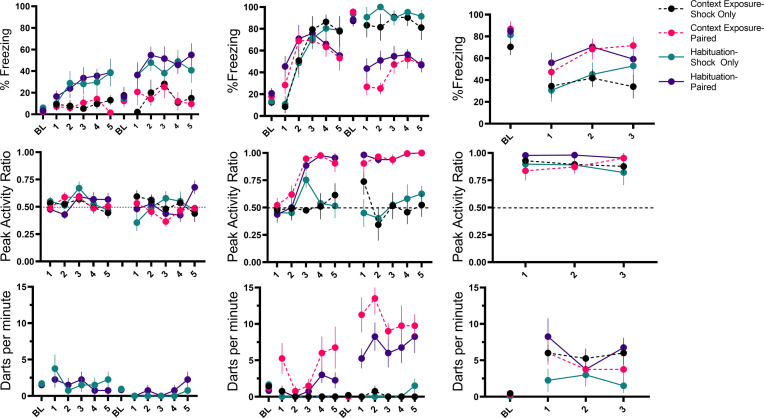
Figure 8—figure supplement 1. Trial-by-trial mean (± SEM) percent freezing, peak activity ratio, and darting per minute throughout all stimulus presentations during habituation (left panels), training (middle panels), and testing (right panels) for Experiment 4 (n=8 per group).

Figure 8—figure supplement 1.

For habituation, presented are the values during CS presentation for habituation groups and values during the same 10 s period for context exposure groups. For training, presented are the values during CS exposure for the paired groups and values during the same 10 s period for shock only groups. For testing, all presented values are during the 10 s CS presentation. See Figure 8—figure supplement 1—source data 1 and Figure 8—figure supplement 1—source data 2.
Figure 8—figure supplement 1—source data 1. Source files for freezing, PAR, and darting for all of Experiment 4.
Figure 8—figure supplement 1—source data 2. Source files for velocity for all of Experiment 4.