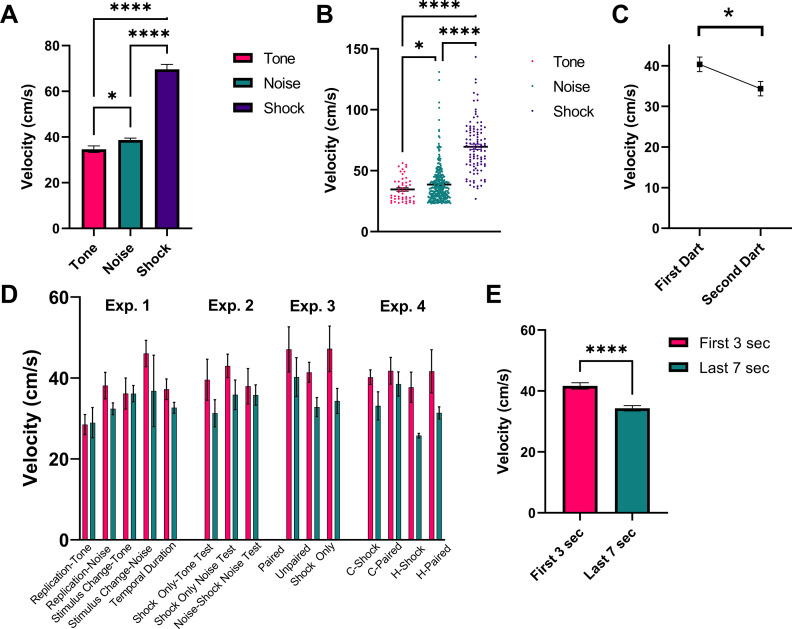
Figure 9. Analysis of dart timing and magnitude.
(A) and (B) represent the magnitude of darts to the tone (n=48 darts) and noise (n=360 darts) stimuli during testing, as well as the reaction to the first shock (n=102 shocks) on day 1 of training. Data are presented as mean ± SE and come from all groups (total n=102 animals) that received shock during training, collapsed across all experiments. p-values and significance were determined through Welch’s ANOVA. *p<0.05, ****p<0.0001. (C) represents the magnitude (mean ± SE) of the first and second dart within a single CS presentation for all animals across all experiments that performed two darts within a single 10 s CS period (n=65 “multi-darts”). p-values and significance were determined through a paired sample t-test. *p<0.05. (D) and (E) represent the magnitude of darts that occurred during the initial 3 s of the 10 s CS period (n=230 darts) and those that occurred during the final 7 s of the 10 s CS period (n=178 darts). Data are presented as mean ± SE and come from all groups that received shock during training (n=102 animals), displayed by group and stimulus type in (D) and collapsed across all experimental groups in (E). p-values and significance were determined through Welch’s ANOVA. ****p<0.0001. See Figure 9—source data 1.

