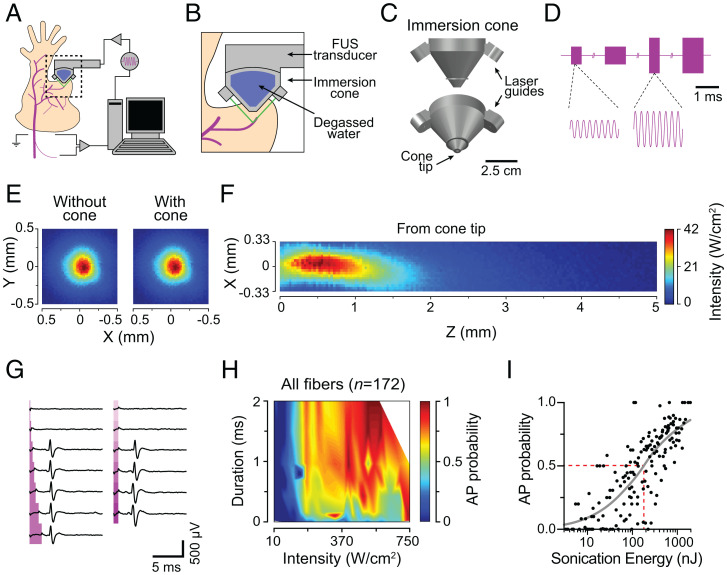
Fig. 1.
Ultrasound evokes action potentials from mouse sensory neurons. (A) Experimental setup. (B) Laser-guided (green) targeting of RFs. (C) Immersion cone. (D) Representative driving signal (3.57 MHz). Amplitude modulates intensity; cycle number modulates stimulus duration. (E) X-Y ultrasound beam profile without (Left) and with (Right) the cone demonstrates that the cone does not disrupt the beam. (F) X-Z beam profile measured from the cone tip (z = 0). (G) Representative FUS-evoked action potentials. Traces recorded sequentially from top to bottom. Magenta regions denote FUS stimulation. Left, Duration exploration (0.1, 0.25, 0.50, 1.0, 1.5, and 2.0 ms) with fixed intensity (155 W/cm2). Right, Intensity exploration (45 to 340 W/cm2, ∼55 W/cm2 steps) with fixed duration (0.75 ms). (H) Aggregate FUS parameter–probability space of all neurons recorded (n = 164 parameter sets; Materials and Methods). (I) Transform of H into total sonication energy. Gray line denotes fit to stimulus-response data (MaxAP = 1.0, slope = 0.79, EC50 = 186, E50%Prob = 186, R2 = 0.64), where EC50 represents the half maximal effective energy relative to the fit maximum, and E50%Prob represents the half maximal effective energy relative to a probability of 1.0. AP, action potential. Red dotted line denotes E50%Prob.

