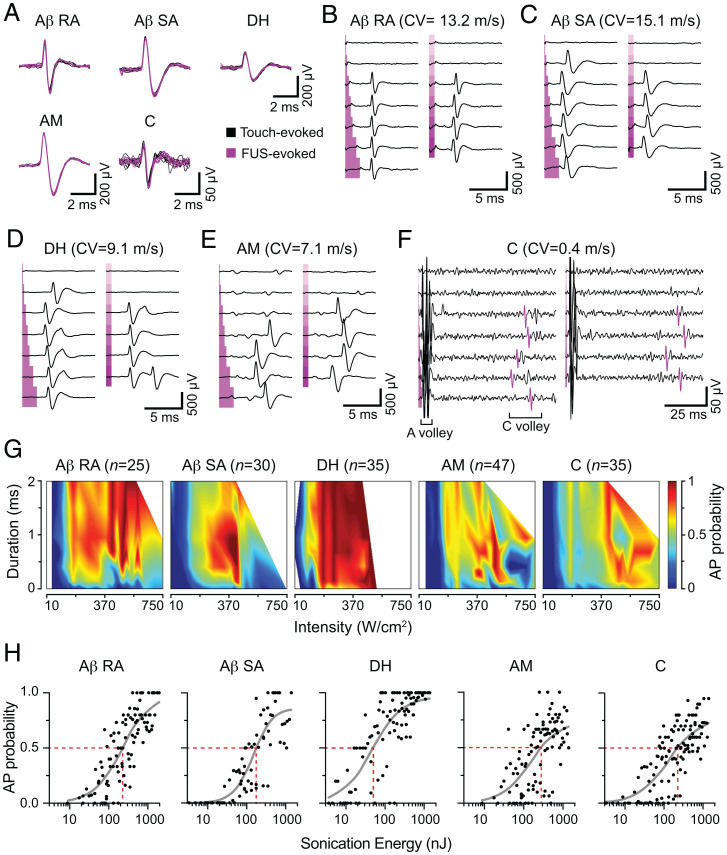
Fig. 2.
Distinct classes of mechanosensory neurons are excited by FUS. (A) Representative mechanically (black, seven traces) and ultrasound-evoked (magenta, seven traces) action potentials from afferents categorized by mechanosensory classes: Aβ RA, Aβ SA, DH, and AM. (B–F) Representative parameter space exploration from different afferent classes, displayed as in Fig. 1G. Each panel represents data from a single experiment. Left, Duration exploration (0.1, 0.25, 0.50, 1.0, 1.5, and 2.0 ms) at fixed intensity, as noted below. Right, Intensity exploration (unless noted, range = 45 to 340 W/cm2, ∼55 W/cm2 steps) with fixed duration (0.75 ms). (B) Aβ RA unit. Duration exploration intensity = 460 W/cm2. Intensity exploration range = 390 to 540 W/cm2, ∼30 W/cm2 steps. (C) Aβ SA unit. Duration exploration intensity = 155 W/cm2. (D) DH unit. Duration exploration intensity = 460 W/cm2. (E) AM unit. Duration exploration intensity = 460 W/cm2. (F) C-fiber unit. Duration exploration intensity = 220 W/cm2. Action potentials highlighted in purple display the spikes that were sorted and analyzed in the representative experiment. (G) Aggregate FUS parameter–probability space representation of all neurons recorded, separated by mechanosensory class. Pseudocolor axis represents action-potential probability (parameter sets: Aβ RA, n = 101; Aβ SA, n = 76; DH, n = 100; AM, n = 101; C-fiber, n = 125). (H) Transform of the data in F into total sonication energy (Materials and Methods). Data are displayed as the mean action-potential probability at each sonication energy sampled. Gray line denotes dose-response curve (SI Appendix, Table S2 for fit values). Red dotted line denotes E50%Prob.

