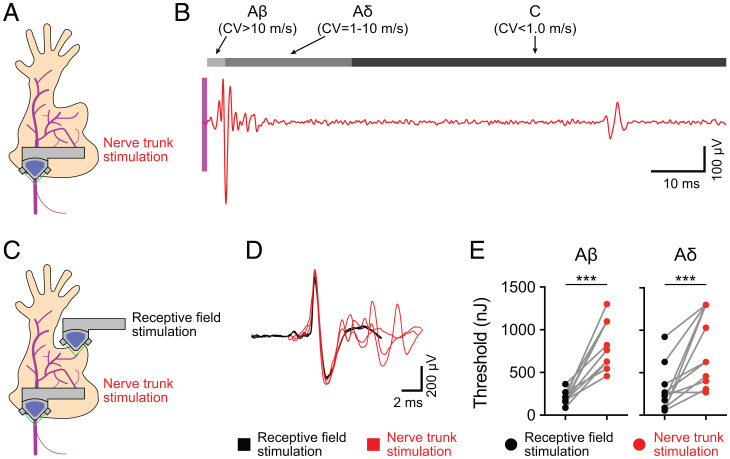
Fig. 4.
NT FUS stimulation evokes action potentials. (A) Overview of experimental setup. NTs were targeted with FUS, and action potentials were recorded. (B) Representative recording, demonstrating FUS-evoked (magenta region denotes time of FUS stimulation) compound action potentials from Aβ, Aδ, and C-fibers. (C) Experimental setup to compare RF and NT FUS stimulation. Mechanosensory afferents were first identified with the manual exploration of RFs with a blunt glass probe. Once identified and classified, afferents were sequentially stimulated with FUS targeted to NTs and RFs. (D) Comparison of FUS-evoked action potentials elicited by RF stimulation (black) and NT stimulation (red). (E) Comparison of sonication energy thresholds (> 50% probability of eliciting an action potential) from FUS stimulation targeted to RFs or NTs from the same fiber. Gray lines represent thresholds from the same fiber. Left, Aβ fibers; Right, Aδ fibers (***P = 0.001; Wilcoxon matched-pairs signed rank test; n = 11 in Aβ fibers and n = 12 in Aδ fibers).

