Fig. 5.
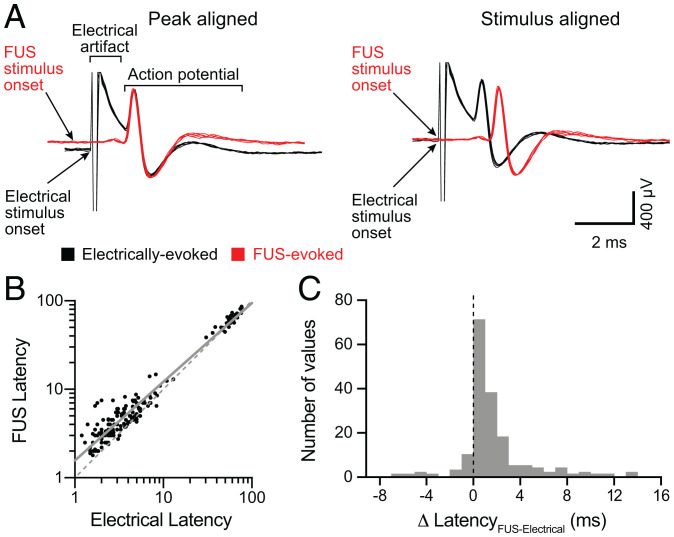
FUS evokes action potentials with millisecond latencies compared with electrical stimulation. (A) Comparison of representative FUS-evoked (red) to electrically evoked (black) action potentials from the same Aβ SA fiber (CV = 15.0 m/s). Left, Action potentials aligned to peak. Right, Action potentials aligned to the onset of stimulation (arrows indicate stimulus onset). (B) Scatterplot of log-transformed FUS-evoked versus electrically evoked action-potential latencies (defined as time from stimulus onset to action-potential positive peak). Gray solid line denotes linear regression of log-transformed data (slope = 0.89; y-intercept = 0.20, R2 = 0.95). Gray dotted line denotes y = x. (C) Histogram of the difference between FUS-evoked and electrically evoked action-potential latencies from each neuron.

