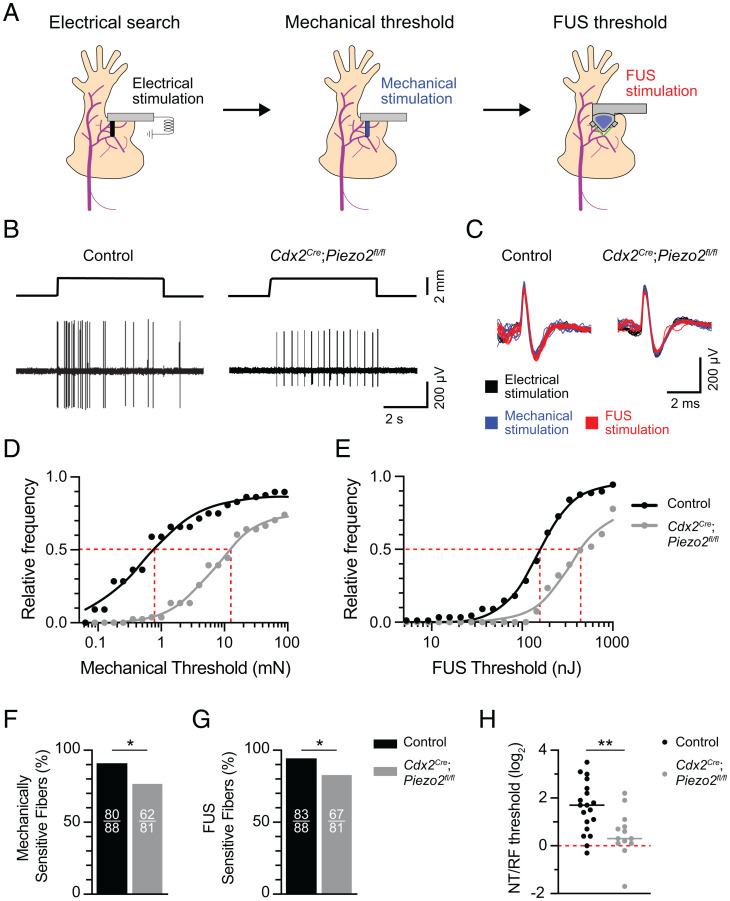
Fig. 6.
FUS stimulates action potentials at sensory RFs in part through the mechanically activated ion channel PIEZO2. (A) Experimental overview. Afferents were identified using an electrical search (Materials and Methods). Next, electrically identified RFs were stimulated with mechanical and FUS stimulation to measure mechanical and sonication energy thresholds, respectively. (B) Representative mechanically evoked responses from control (Left) and Cdx2Cre;Piezo2fl/fl (Right) mice. Top traces, displacement; Bottom traces, action-potential trains. (C) Representative action-potential traces evoked by electrical (black), mechanical (blue), and FUS (red) stimuli from control and Cdx2Cre;Piezo2fl/fl mice. (D and E) Cumulative response plots for mechanical (D) and FUS thresholds (E) from control and Cdx2Cre;Piezo2fl/fl mice (control: n = 88 fibers, five mice; Cdx2Cre;Piezo2fl/fl: n = 81 units, six mice). Black and gray lines denote stimulus-response fits (SI Appendix, Table S3 for fit values). Gray dotted line denotes E50%Respond. (F and G) Proportions of mechanically (F) and FUS-sensitive (G) fibers in control (black) and Cdx2Cre;Piezo2fl/fl (gray) mice. Numbers of sensitive fibers are listed as insets within bars. In F, *P = 0.01; in G, *P = 0.02 (two-sided Fisher’s exact test). (H) FUS thresholds at NTs and RFs were measured for individual A-fiber units (control: n = 19 fibers, three mice; Cdx2Cre;Piezo2fl/fl: n = 13 fibers, four mice). NT/RF threshold ratios were calculated and log2 transformed to achieve normally distributed populations. Means were compared with unpaired, two-tailed Student’s t test (**P = 0.006).

