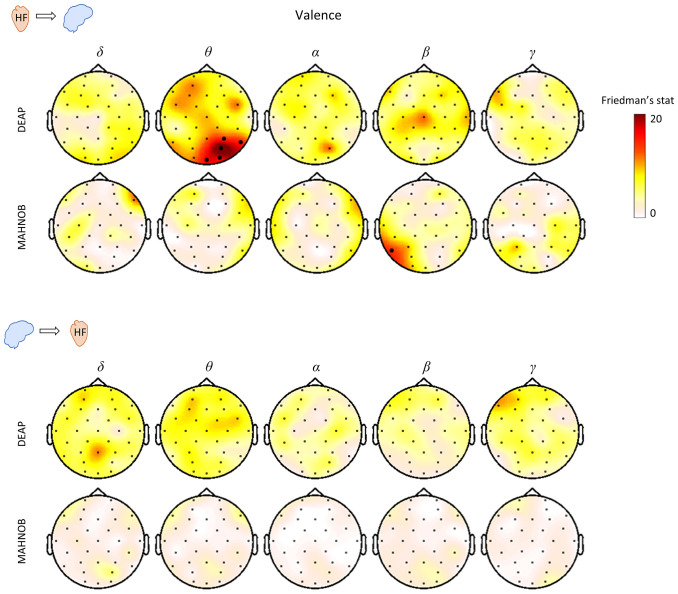
Fig. 4.
Scalp distribution of the Friedman test statistics for the HF-to-brain and brain-to-HF comparison between three levels of valence. Trials for each group of arousals were averaged separately for the two datasets. Colormaps indicate the amplitudes of the respective Friedman statistic and thick electrodes indicate significance (P < 0.05/32).

