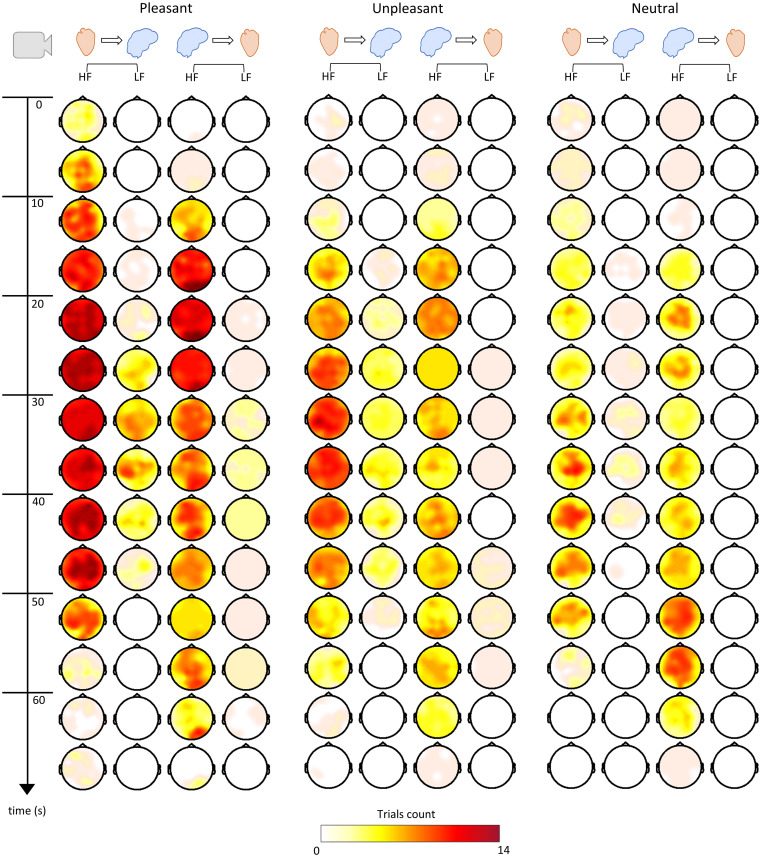
Fig. 7.
BHI time course trial visualization. The scalp topographies displayed correspond to HF-to-brain, LF-to-brain, brain-to-HF, and brain-to-LF. Colormaps indicate the number of videos in which the 5-s group-median SDG coefficients during the emotion elicitation have been found significant compared to the rest coupling coefficients previously subtracted per subject.

