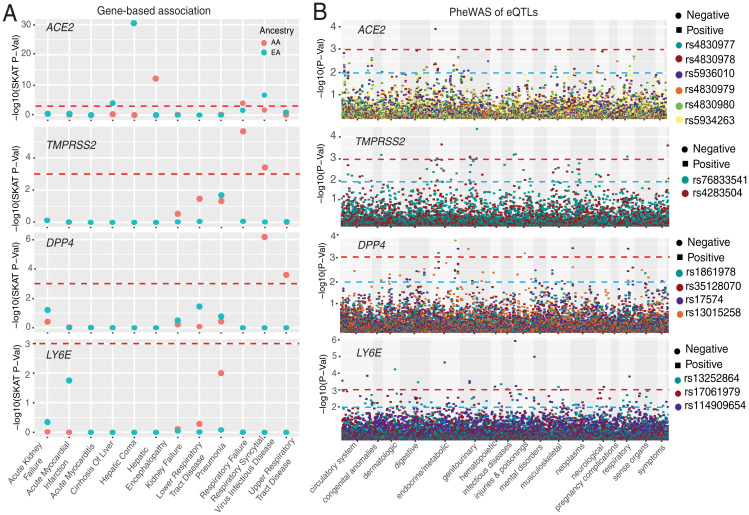
Fig. 6.
Associations between genetic variations at four genes and clinical disease phenotypes. (A) Gene-based association result between coding variants at four genes and 12 disease classes. The disease classes are shown on the x axis, and the y axis represents the P values. (B) PheWAS plot of the eQTLs associated with four genes and ∼1,800 disease codes across 17 disease categories. The disease categories are shown on the x axis, and the y axis represents the −log10 of the P values. The colored dots represent eQTLs and the direction of effect of the association. The red dashed lines denote the 0.0001 cutoff, and the blue dashed lines represent the 0.001 cutoff.

