Fig. 1.
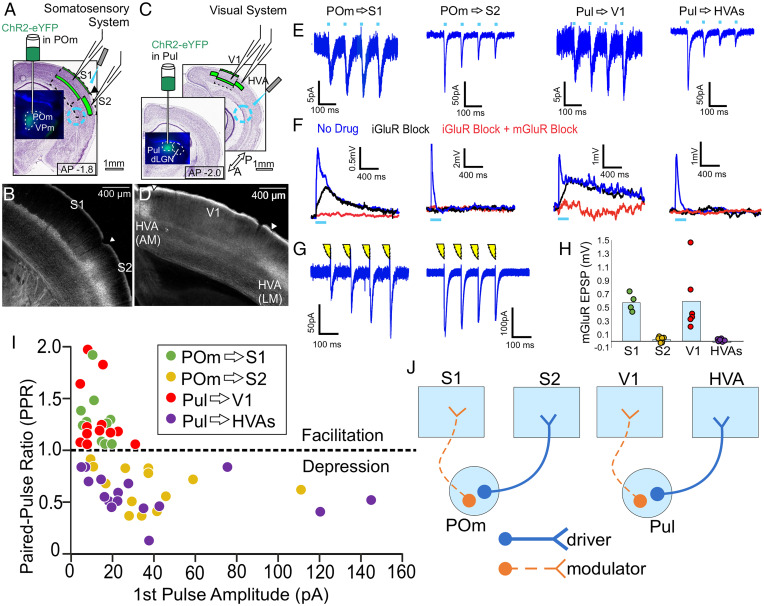
HO thalamocortical synapses exert different effects on primary vs. higher cortical areas. (A) A schematic of experimental strategy to evaluate HO thalamocortical synapses in the somatosensory system. AAV9-pACAGW-ChR2-Venus was injected into the HO thalamic nucleus POm, allowing visualization and focal laser stimulation of POm axons in an acute slice during whole-cell recordings from S1 or S2. AP denotes rostrocaudal distance in mm from bregma throughout. (B) ChR2-Venus + POm axons densely innervate layer 5a of S1 and layers 2/3 and 4 of S2, showing a clear border. (C) Same experimental strategy as in (A), but evaluating HO thalamocortical synapses of the visual system by injecting AAV9-pACAGW-ChR2-Venus into Pul, allowing visualization and focal laser stimulation of Pul axons during whole-cell recordings from V1 or HVAs. (D) ChR2-Venus + Pul axons densely innervate layer 5a of V1 and layers 2/3 and 4 of HVAs, showing a clear border. (E) Example voltage clamp recordings from S1 and S2 during optogenetic stimulation of POm axons (10 Hz, 1 ms pulse duration, >300 µm away from the recording site), or from V1 or HVAs during stimulation of Pul axons also >300 µm away from the recording site. All 10 Hz responses blockable with iGluR blockers DNQX and APV. (F) Example current clamp recordings during high frequency stimulation over presynaptic terminals (83 Hz, 1-ms pulse duration) of the same HO thalamic axons as in (E). Blue traces are responses before the application of drugs. Black traces are during bath application of iGluR blockers DNQX and APV, and red traces are in the presence of iGluR blockers and group 1 mGluR blockers LY367385 and MPEP. (G) Example voltage clamp recordings from S1 and S2 during electrical stimulation of POm axons (10 Hz, 0.1-ms duration) in a connected thalamocortical slice. (H) mGluR-dependent responses to high frequency stimulation in S1 (n = 4 cells), S2 (n = 6), V1 (n = 6), and HVAs (n = 6). mGluR responses in S1 (0.58 mV ± 0.07) and S2 (0.03 mV ± 0.02) are significantly different from each other (P = 9.5 × 10⁻³, Mann-Whitney U test throughout unless otherwise specified), and mGluR responses in V1 (0.59 mV ± 0.19) and HVAs (-0.015 mV ± 0.028) are significantly different from each other (P = 2.2 × 10⁻³). Here and later figures, bars represent the mean while dots represent the data for individual cells. (I) Scatterplot showing relationship of paired-pulse ratio (second EPSC amplitude/first EPSC amplitude) and amplitude of the first evoked EPSC in a train for thalamocortical inputs to cortical neurons. Data include cells in S1 (n = 12, green), S2 (n = 13, tan), V1 (n = 12, red), and HVAs (n = 16, purple). PPRs in S1 (1.27 ± 0.07, mean ± SEM throughout) and S2 (0.64 ± 0.05) are significantly different from each other (P = 3.9 × 10⁻⁷), and PPRs in V1 (1.30 ± 0.09) and HVAs (0.57 ± 0.05) are significantly different from each other (P = 6.6 × 10⁻⁸). Response amplitudes in S1 (12.0 pA ± 1.60) and S2 (37.8 pA ± 7.24) are significantly different from each other (P = 3.4 × 10⁻⁴), and response amplitudes in V1 (13.3 pA ± 2.35) and HVAs (38.8 pA ± 10.21) are significantly different from each other (P = 2.0 × 10⁻²). (J) Summary of data interpreted in the context of glutamatergic drivers and modulators.

