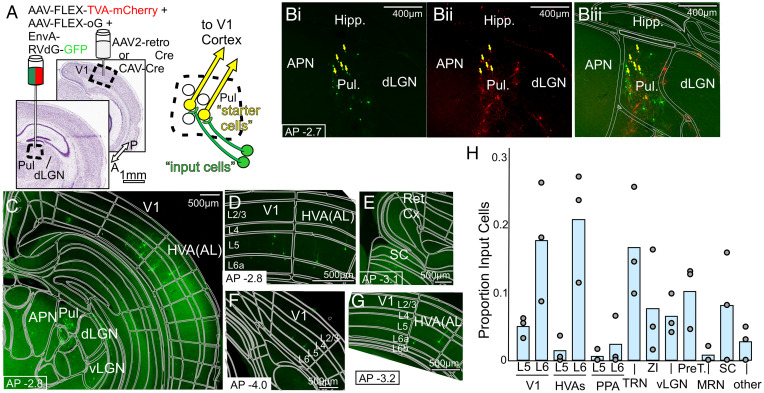
Fig. 3.
Retrograde transsynaptic tracing of inputs to the Pul → V1 pathway. (A) Schematic of the anatomical labeling strategy for labeling presynaptic inputs to the Pul → V1 pathway (see Results and Materials and Methods for details) (B) Representative images of Pul, with GFP+ (B, i) and mCherry+ (B, ii) cells double labeled (yellow arrows) in Pul only (overlay in B, iii). (C–G) Representative epifluorescence images of GFP+ presynaptic “input” cells, projecting to the Pul → V1 pathway. Cortical layers are labeled L2/3, L4, etc. Abbreviations: APN, anterior pretectal nucleus, Ret. Cx, retrosplenial cortex. (H) Location of presynaptic GFP+ input cells as a proportion of the number of input cells found in each mouse (n = 3 animals). Of note are labeled input cells in layer 5 of several cortical areas and SC cells labeled in two animals, although missing in an animal with a slightly more anterior Pul injection.

