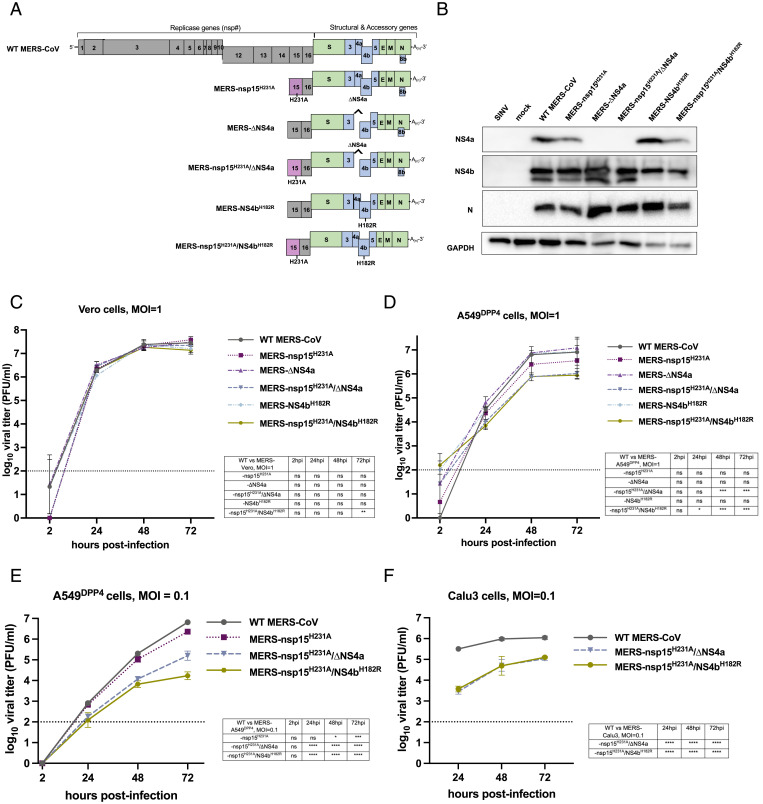
Fig. 1.
Recombinant MERS-CoV design and replication kinetics. (A) Diagram of the MERS-CoV genome including the replicase locus (encoding 16 nsps), structural genes, and accessory genes is shown along with a diagram of each recombinant mutant constructed using the BAC reverse genetics system. (B) A549DPP4 cells were infected at MOI = 5 with the indicated viruses, and protein lysates were harvested at 24 hpi. Expression of NS4a and NS4b was determined by SDS/PAGE and Western blot. (C) Vero cells were infected in triplicate at MOI = 1 with the indicated viruses. Supernatants were collected at the indicated hpi, and infectious virus was quantified by plaque assay. (D) A549DPP4 cells were infected in triplicate with the indicated viruses at MOI = 1, and replication was quantified as in C. Data in C and D are from one representative of three independent experiments. (E) A549DPP4 and (F) Calu-3 cells were infected in triplicate with the indicated viruses at MOI = 0.1, and replication was quantified as in C. All data in C–F are displayed as means ± SD. The dotted line in C–F indicates the limit of detection of the plaque assay. Statistical significance of each recombinant virus compared to WT MERS-CoV was calculated by repeated measures two-way ANOVA: *P ≤ 0.05; **P ≤ 0.01; ***P ≤ 0.001; ****P ≤ 0.0001. Data that were not statistically significant are labeled ns.

