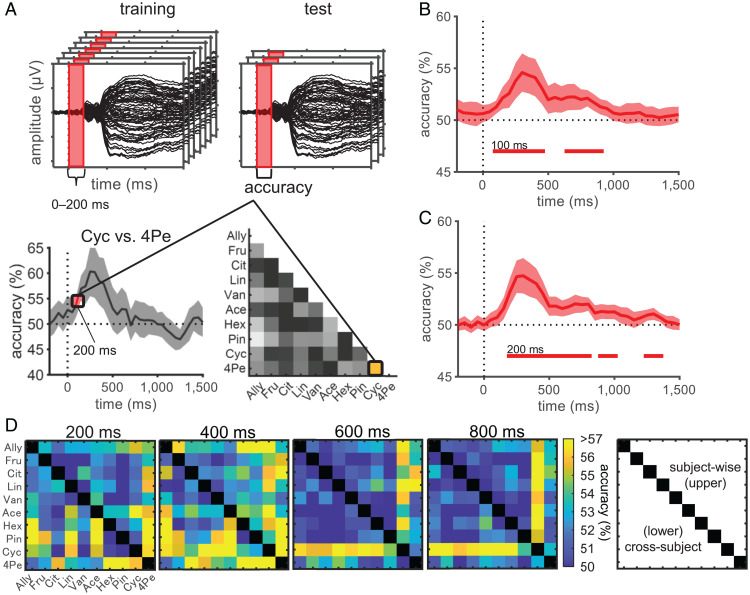
Fig. 2.
Pairwise decoding revealed temporal dynamics of odor information representations. (A) Schematic representation of the tMVPA pairwise decoding. An odor pair, Cyc vs. 4Pe, for time = 200 ms is shown as an example. Decoding models were built for each of the 45 odor pairs for each time point. For a given time point, single-trial event-related potential amplitudes at all 64 scalp electrodes within a preceding time interval of 200 ms were concatenated and used as features. To avoid underestimation of latency, we assigned the accuracy to the last time point in each time window (e.g., the accuracy obtained using OERPs during 0 to 200 ms was assigned to 200 ms). Using a cross-validation protocol, for subject-wise decoding, a random sample of 90% of EEG trials was used for training, and the remaining 10% were used for testing. For cross-subject decoding, EEG trials from 21 subjects were used for training, and those of the remaining one subject were used for testing. The entire procedure was repeated for 60 cross-validations for subject-wise decoding and until all subjects were used as a test set for cross-subject decoding. The grand mean accuracy of subject-wise decoding (B) and cross-subject decoding (C) averaged across 45 odor pairs. Bottom horizontal lines indicate statistical significance (one-sided, one-sample Student’s t test, P < 0.05, Bonferroni–Holm corrected), with numbers indicating their onsets. Shaded areas indicate 95% confidence intervals across subjects (B) or across outer-loop CVs (C). (D) Decoding accuracies of each odor pair at specified time points. The upper triangular matrix corresponds to subject-wise decoding, and the lower one corresponds to cross-subject decoding. Abbreviations of odors are shown at the left and bottom (see Materials and Methods for full names).

