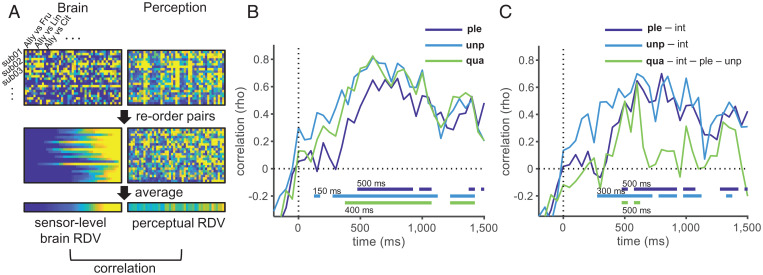
Fig. 3.
Temporal evolution of neural representations underlying olfactory perception. (A) Procedures followed for tRSA exemplified for one time point. For each subject (shown as “sub01-03…”), brain representational dissimilarities were measured as pairwise decoding accuracies based on the subject-wise model, and the perceptual representational dissimilarities were measured as pairwise Euclidean distances based on perceptual scores, each resulting in a vector with 45 elements. These vectors were sorted according to the decoding accuracy for the given time point and then were averaged across subjects to obtain the RDVs. We calculated the Spearman’s rank correlation between the brain and perceptual RDVs. This procedure was performed at the same temporal resolution as the decoding analysis (every 50 ms). Results of tRSA with zero–order correlation (B) and with partial correlation (C). For unipolar pleasantness and unpleasantness, intensity was controlled for, and for quality, intensity, unipolar pleasantness, and unpleasantness were controlled for. The bottom horizontal lines indicate the statistical significance (permutation test, 10,000 permutations; P < 0.05, Bonferroni–Holm corrected), with numbers indicating their onsets. Ple, unipolar pleasantness; unp, unipolar unpleasantness; qua, quality; int, intensity. Results for other variables (intensity, pleasantness evaluated during EEG recordings, similarity, and trigeminal) are shown in SI Appendix, Fig. S4A.

