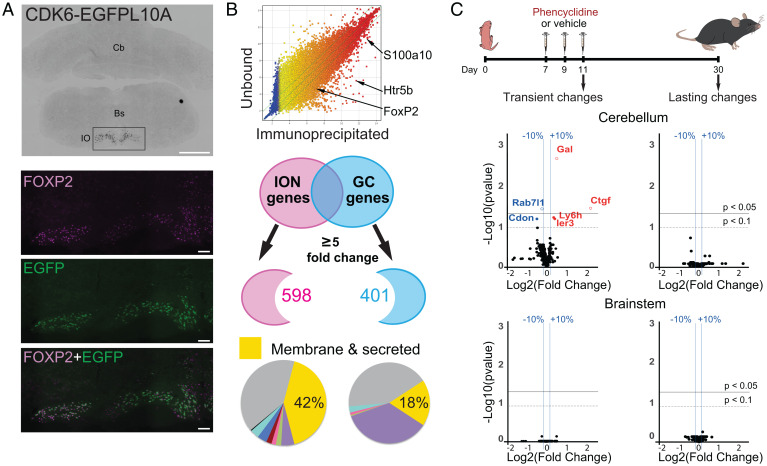
Fig. 3.
Neonatal PCP administration induces transient translatome changes in the cerebellum. (A) Translational profiling of IONS. The Cdk6 BAC driver was used to drive specifically EGFPL10A expression in IONS of the brainstem in adult mice (CDK6-EGFPL10A). Immunostaining with an antibody against Foxp2, an ION-specific transcription factor, confirmed the identity of EGFPL10A-expressing neurons. Bs, brainstem; Cb, cerebellum. (Scale bars: CDK6-EGFPL10A, 1 mm; FOXP2 and EGFP, 100 µm.) (B) ION-enriched mRNAs were identified by comparing the immunoprecipitated fraction with the unbound fraction. Known markers of IONs, FoxP2, Htr5b, and S100A10, were identified in the immunoprecipitated fraction. The ION dataset was compared with the GC dataset previously identified (66) to identify input-specific genes (with a threshold of five). DAVID bioinformatics was then used to classify these specific genes according to their cellular localization and to identify the genes coding for the surfaceome (membrane and secreted proteins). (C) Experimental design. PCP or vehicle is injected subcutaneously in neonatal mice at P7, P9, and P11. Gene expression changes were analyzed from both cerebellum and brainstem mRNA extracts at either P11, to detect immediate changes after PCP treatment, or at P30, to detect long-lasting changes. Volcano plots are used to represent the changes in gene expression detected in the four groups. Each dot represents the fold change for a gene and the corresponding corrected P value [using the Benjamini–Hochberg correction for multiple t test comparison (69)]. y axis: −log10 of corrected P values. x axis: log2 of gene fold change. The top black horizontal lines correspond to an FDR threshold set to 5%, the bottom dotted lines correspond to an FDR set to 10%, and the vertical blue bars correspond to a fold change in gene expression level of 10%. Genes with an FDR < 5% are represented with empty circles.

