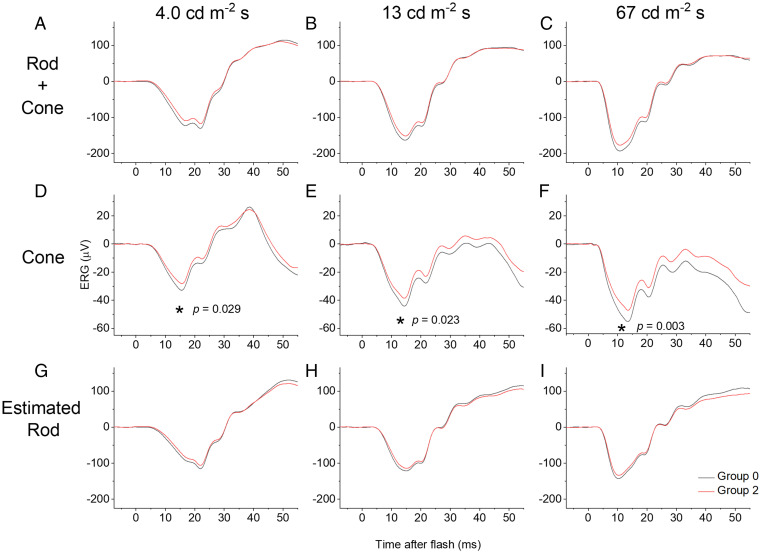
Fig. 2.
Averaged ERG responses to white flashes delivered in the dark (A–C) and on a rod-saturating blue background (D–F), and estimated dark-adapted rod-isolated responses (G–I). Black traces are from participants with no risk alleles (group 0) at the locus of interest; red traces are from participants homozygous for the risk allele (group 2). (A–C) Responses to white xenon flashes (photopic intensities shown) delivered in the dark. (D–F) Responses to identical flashes delivered on a blue background (30 scotopic and 1.0 photopic cd⋅m−2), chosen to saturate the rods but minimally affect the cones, and thus yield an estimate of the dark-adapted cone response. (G–I) Estimated isolated rod-driven responses obtained by numerical subtraction of traces in D–F from those in G–I. (Note that these traces might still contain a minor cone component if cones are slightly desensitized by the blue background.) Using the mixed linear model, a significant effect was observed across groups only for cone-driven a-wave amplitudes (denoted by asterisks in D–F).

