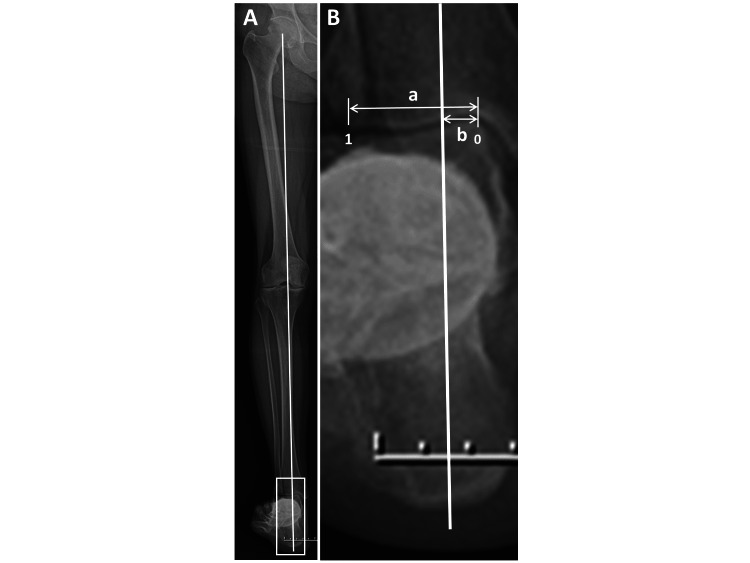
Figure 2. Radiography to measure loading point index (ratio).
A) Hip-to-calcaneus radiograph. The solid line shows the loading axis: between center of the femoral head and calcaneal tip.
B) Enlarged radiograph of the ankle area (white lined box) shown in panel A. Loading point index is measured as b/a. (From 0 (ratio) [medial end of distal plafond of the tibia] to 1 (ratio) [lateral end of distal plafond of the tibia]).

