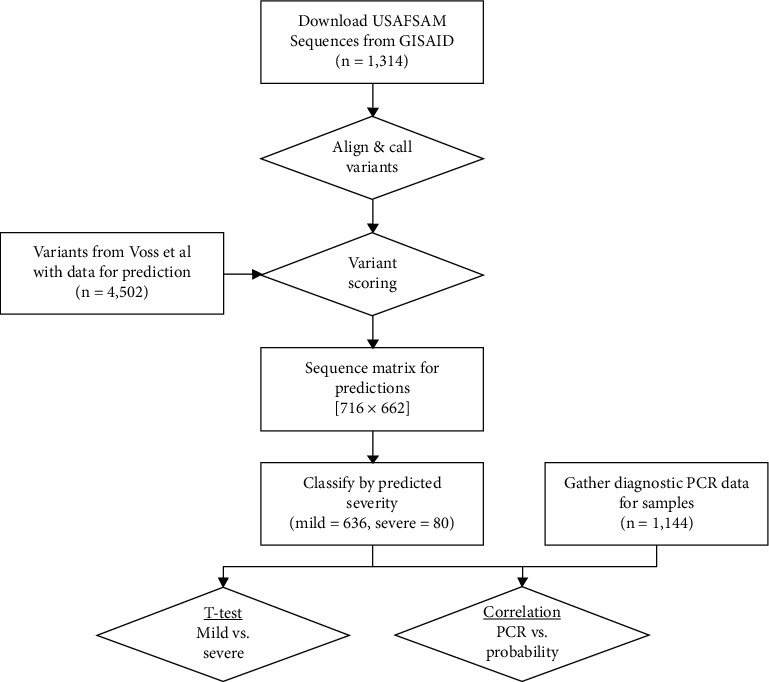
Figure 1.

Process flowchart for orthogonal validation of a severity prediction algorithm. Sequences were downloaded from GISAID, processed through reference alignment and variant calling, predicted based upon variants identified by Voss et al., and compared to observed PCR threshold data by the t-test and correlations. The matrix used for predictions was 716 samples with 662 variants overlapping the Voss et al. variant list (all other variants were assigned 0 for Python predictions).
