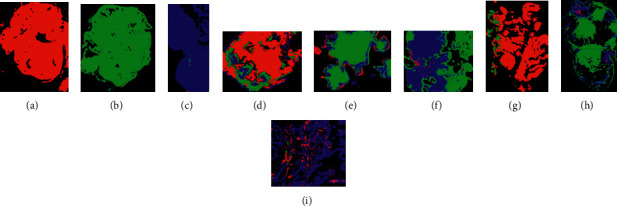
Figure 11.

Ratio of two highest and lowest results by class and results of the pre-diagnosis performed by production tooling: (g) image C18 with a predominance of cancer (red); (h) image I1 with a predominance of inflammation (green); (i) S10 image with a predominance of healthy tissues. All coincide with the previous classification indicated by the pathologist.
