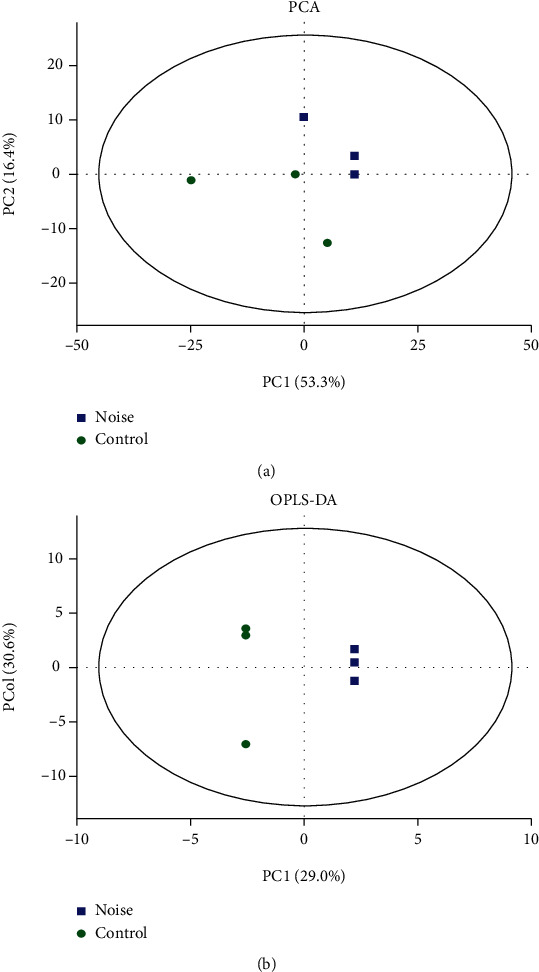
Figure 3.

Cochlea metabolite profiles of noise-exposed mice are different from the control mice. (a) Scoring plots of the PCA model. (b) Scoring plots of the OPLS-DA model. Each point represents an independent sample; green dots represent samples in the noise-exposed group, and blue boxes represent samples in the control group.
