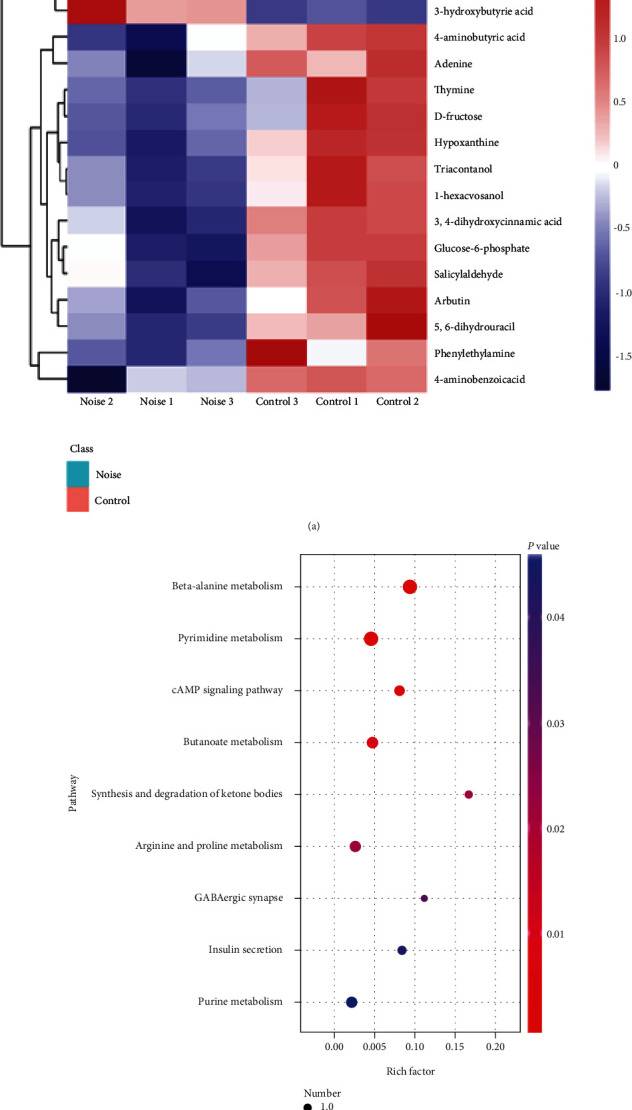
Figure 4.

Significantly altered metabolites and pathways caused by noise exposure. (a) A visual clustering heat map of the 17 differential metabolites (VIP > 1 and P < 0.05) between noise-exposed and control groups. (b) Scatter diagram of enriched KEGG pathways. Axis x represents the rich factor, and axis y represents the name of the enriched signaling pathway. The size of dots indicates the number of differential expression metabolites in a particular pathway, and the color of dots shows the range of P value.
