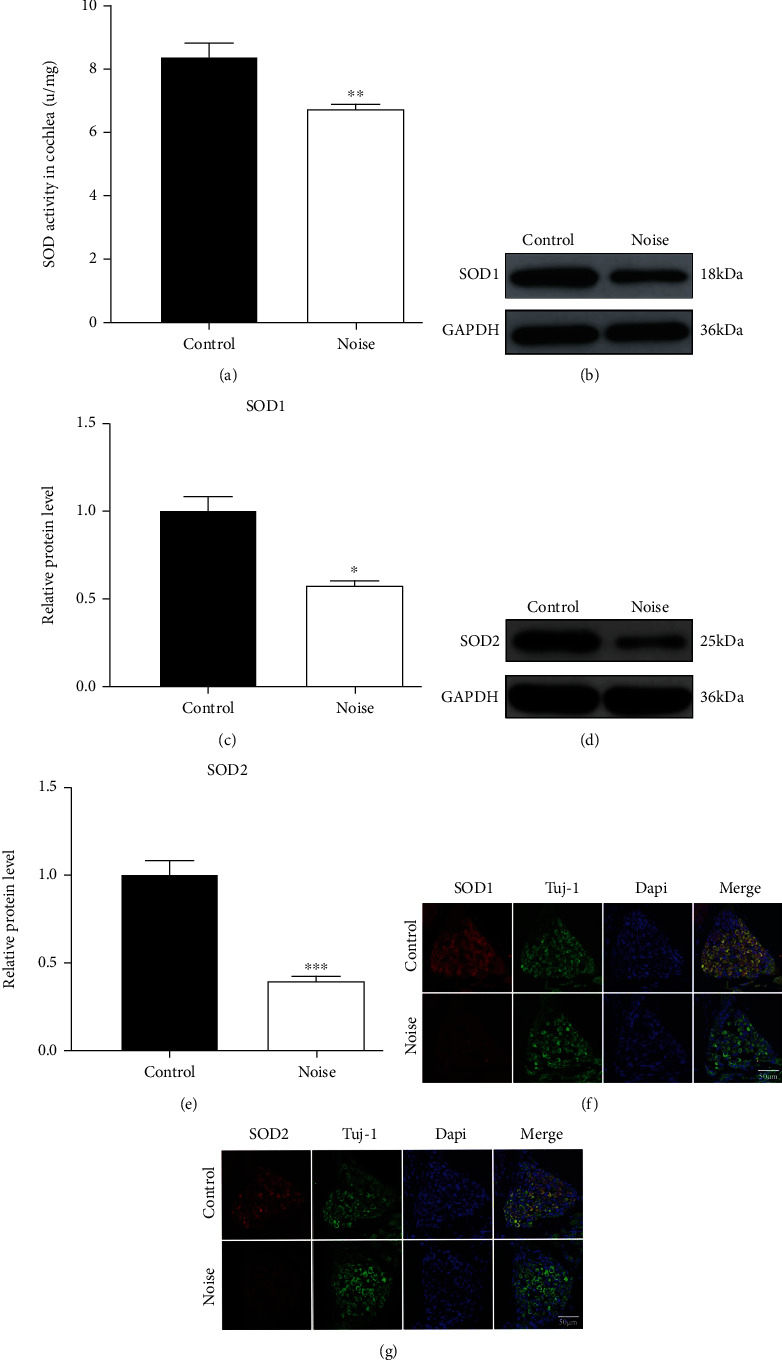
Figure 6.

Detection of oxidative stress level in the cochlea after noise exposure. (a) Comparison of SOD activity in the cochlea between control and noise groups. (b, c) Western blotting showing the expression level of SOD1 protein in the mouse cochlea between the control and noise groups. (d, e) Western blotting showing the expression level of SOD2 protein in the mouse cochlea in the control and noise groups. (f, g) Localization and expression of SOD1 and SOD2 proteins were detected by the immunofluorescence assay in the control and noise groups. Data are represented as mean ± SD. ∗P < 0.05, ∗∗P < 0.01, and ∗∗∗P < 0.001 compared to the control group.
