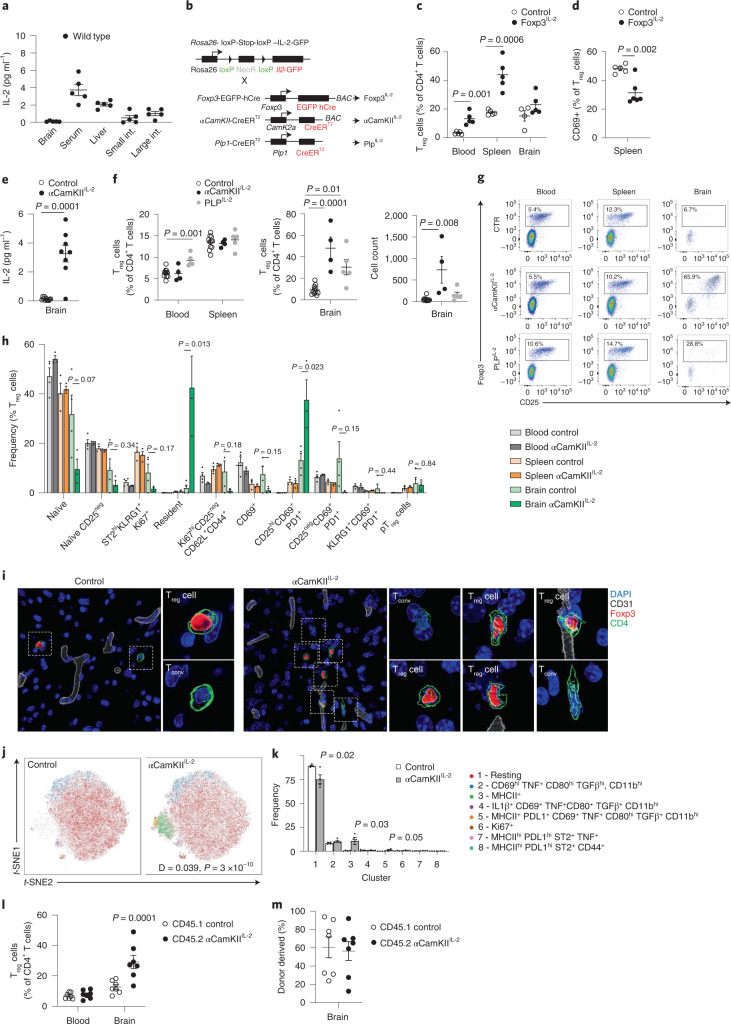
Fig. 1. Local expression of IL-2 drives a brain-specific expansion of Treg cells.
a, IL-2 levels detected by ELISA (n = 5 per group). b, Schematic of transgenic systems for IL-2 expression. c,d, Frequency of Foxp3+ cells within CD4+ T cells (n = 5, 5; c), and CD69+ cells within Treg cells (n = 5, 6; d). e, IL-2 levels detected by ELISA (n = 11, 8). f, Frequency of Foxp3+ cells within CD4+ T cells (n = 8, 4, 5). Absolute number of Foxp3+ cells. g, Representative flow cytometry plots for f indicating Foxp3 and CD25 coexpression. h, Brain, spleen and blood from wild-type and αCamKIIIL-2 mice were compared by flow cytometry (n = 4, 3). i, Surface-rendered image of a Treg cell in the midbrain. A representative picture of three individual mouse samples is shown. Scale bar, 10 µm. j, Brains from wild-type and αCamKIIIL-2 mice were compared by flow cytometry (n = 4, 4; 64,927 cells plotted). t-distributed stochastic neighbor embedding (t-SNE) of microglia built on key markers (CD64, MHCII, PD-L1, CD80, CX3CR1 and CD45). k, Cluster quantification. l, CD45.1 mice parabiosed to tamoxifen-treated CD45.2 αCamKIIIL-2 mice. Percentage of Treg cells within the CD4+ T cell population in the blood and brain of parabiotic pairs (n = 7). m, Proportion of Treg cells from the CD45.1 or CD45.2 donor in the brain of parabiotic pairs. Data from a, c–f, h and k–m are shown as the mean ± s.e.m. Statistical analyses were performed using an unpaired two-tailed Student’s t-test (d and e), unpaired two-tailed Student’s t-test with multiple-test correction (c, h and k), two-way analysis of variance (ANOVA; e and m) and one-way ANOVA (f). All experiments except a, j and k were repeated independently (≥ twice). pTreg, peripheral Treg cell.

