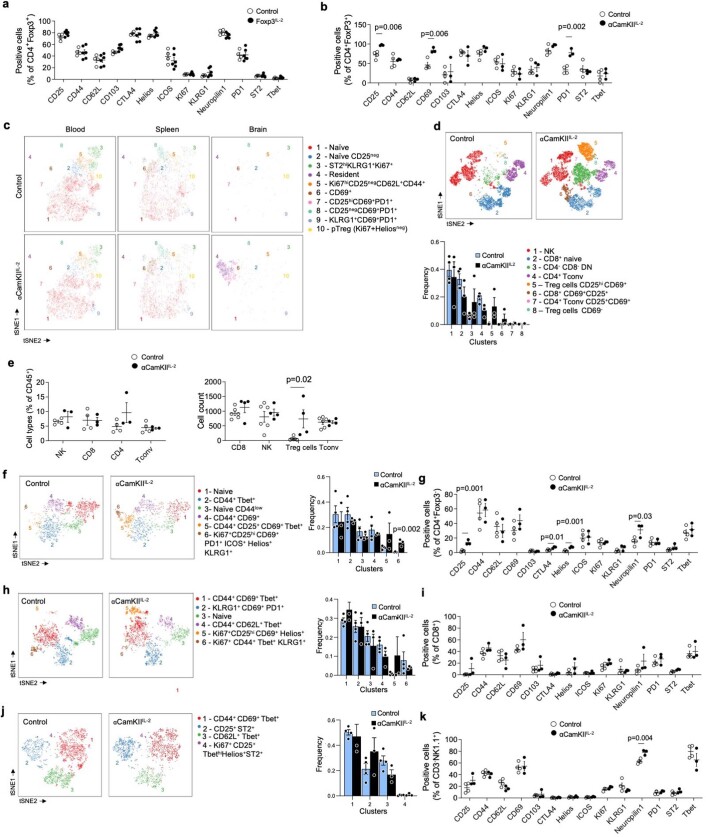
Extended Data Fig. 2. Brain regulatory T cell-specific effects of neuronal IL-2 production.
a, Spleen from wildtype and Foxp3IL-2 mice were compared by flow cytometry (n = 4, 6). Frequency of key markers (CD25, CD44, CD62L, CD103, CTLA4, Helios, ICOS, Ki67, KLRG1, Neuropilin1, PD1, ST2, Tbet) on Treg cells in spleen. b, Brain from wildtype and αCamKIIIL-2 mice were compared by high-dimensional flow cytometry (n = 4, 3). Frequency quantification of key markers on Treg cells. c, tSNE of blood, spleen and brain Treg cells built on key markers. Colors indicate annotated FlowSOM clusters, with quantification in Supplementary Fig. 5 f. tSNE run on samples pooled post-acquisition, with quantification performed on individual samples (n = 4, 3). The residential cluster is characterized as CD25hiCD69 + PD1 + CD103 + . d, tSNE of total leukocytes from brain of wildtype and αCamKIIIL-2 mice, built on lineage markers with quantification. tSNE run on samples pooled post-acquisition, with quantification performed on individual samples (n = 4, 3). e, NK, CD4 and CD8 T cells, (left) as a proportion of CD45 + CD11b− cells in the brain (n = 4, 3)., and (right) in absolute numbers, together with Treg cells (n = 6, 4). f, tSNE of brain CD4 conventional T cells built on key markers (CD62L, CD44, CD103, CD69, CD25, PD-1, Nrp1, ICOS, KLRG1, ST2, Ki67, Helios, T-bet, CTLA4). tSNE run on samples pooled post-acquisition, with quantification performed on individual samples (n = 4, 3). Colors indicate annotated FlowSOM clusters, with quantification and g, frequency of marker expression. h, tSNE of brain CD8 T cells built on key markers. tSNE run on samples pooled post-acquisition, with quantification performed on individual samples (n = 4, 3). Colors indicate annotated FlowSOM clusters, with quantification and i, frequency of marker expression. j, tSNE of brain NK cells built on key markers (t-SNE run on samples pooled post-acquisition, with quantification performed on individual samples (n = 4, 3). Colors indicate annotated FlowSOM clusters, with quantification and k, frequency of marker expression. Data are displayed as mean ± s.e.m. (a,b,d-k). Statistical analyses were performed using multiple unpaired two-tailed Student’s t-test.

