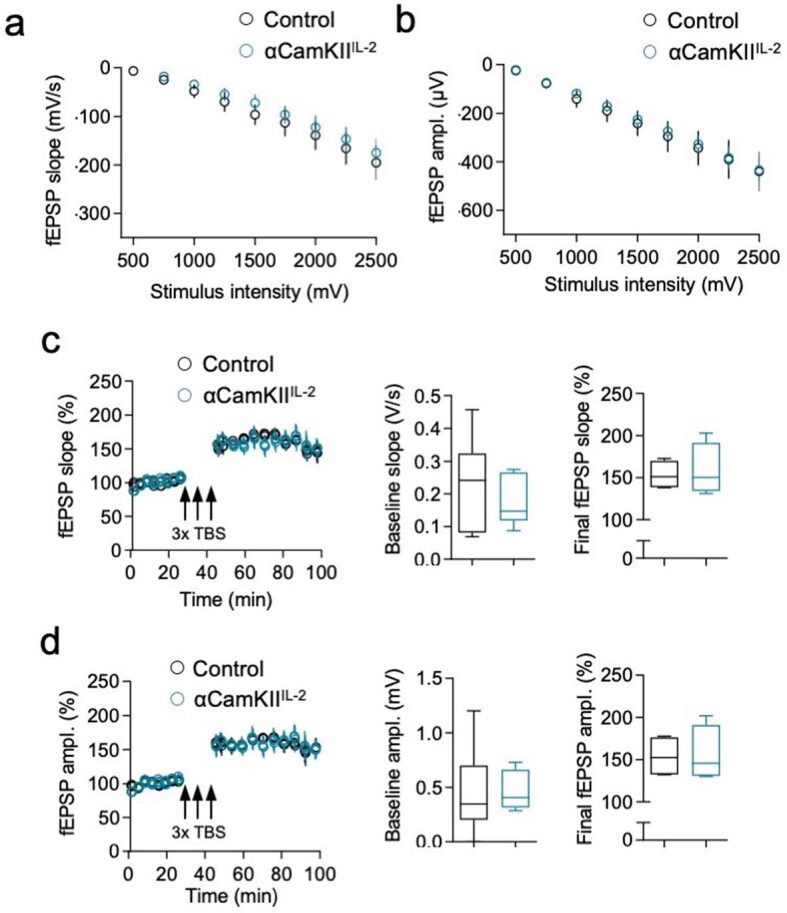
Extended Data Fig. 3. Normal long-term potentiation in αCamKIIIL-2 mice.

Field excitatory post-synaptic potentials (fEPSPs) were recorded from Schaffer collateral-CA1 neuronal synapses in brain slices from wildtype and αCamKIIIL-2 littermates. Input-output curves were recorded for each slice by applying single-stimuli ranging from 500 to 2750 mV with 250 mV increments. a Slope and b amplitude were analyzed (n = 4,4). Long-term potentiation (LTP) was induced by applying three high frequency trains (theta-burst stimulation (TBS): 100 stimuli; 100 Hz) with 5 minutes intervals between trains. After baseline determination, fEPSPs were measured for 55 minutes. Changes in the c slope and d amplitude have been analyzed across time. Boxplots represent quantification of the baseline (left) (Amplitude: Minimum (0, 02845), 25% Percentile, (0.2020, 0.3137), Median (0.3471, 0.4084), 75% Percentile (0.6997, 0.6627), Maximum (1.203, 0.7302); Slope: Minimum (0.06911, 0.08740), 25% Percentile (0.08134, 0.1182), Median (0.2409, 0.1463), 75% Percentile (0.3236, 0.2653), Maximum (0.4574, 0.2747) and final LTP (right) (Amplitude: Minimum (132.1, 130), 25% Percentile (132.4, 130.8), Median (152.7, 145.7), 75% Percentile (176.5, 191.1), Maximum (177.9, 202); Slope: Minimum (138.2, 131.3), 25% Percentile (138.7, 134.4), Median (151.3, 150.3), 75% Percentile (170.3, 191.6), Maximum (173.0, 203.2)). Mean ± s.e.m. (n = 4,4). Statistical analyses were performed using unpaired, nonparametric Mann–Whitney U-test.
