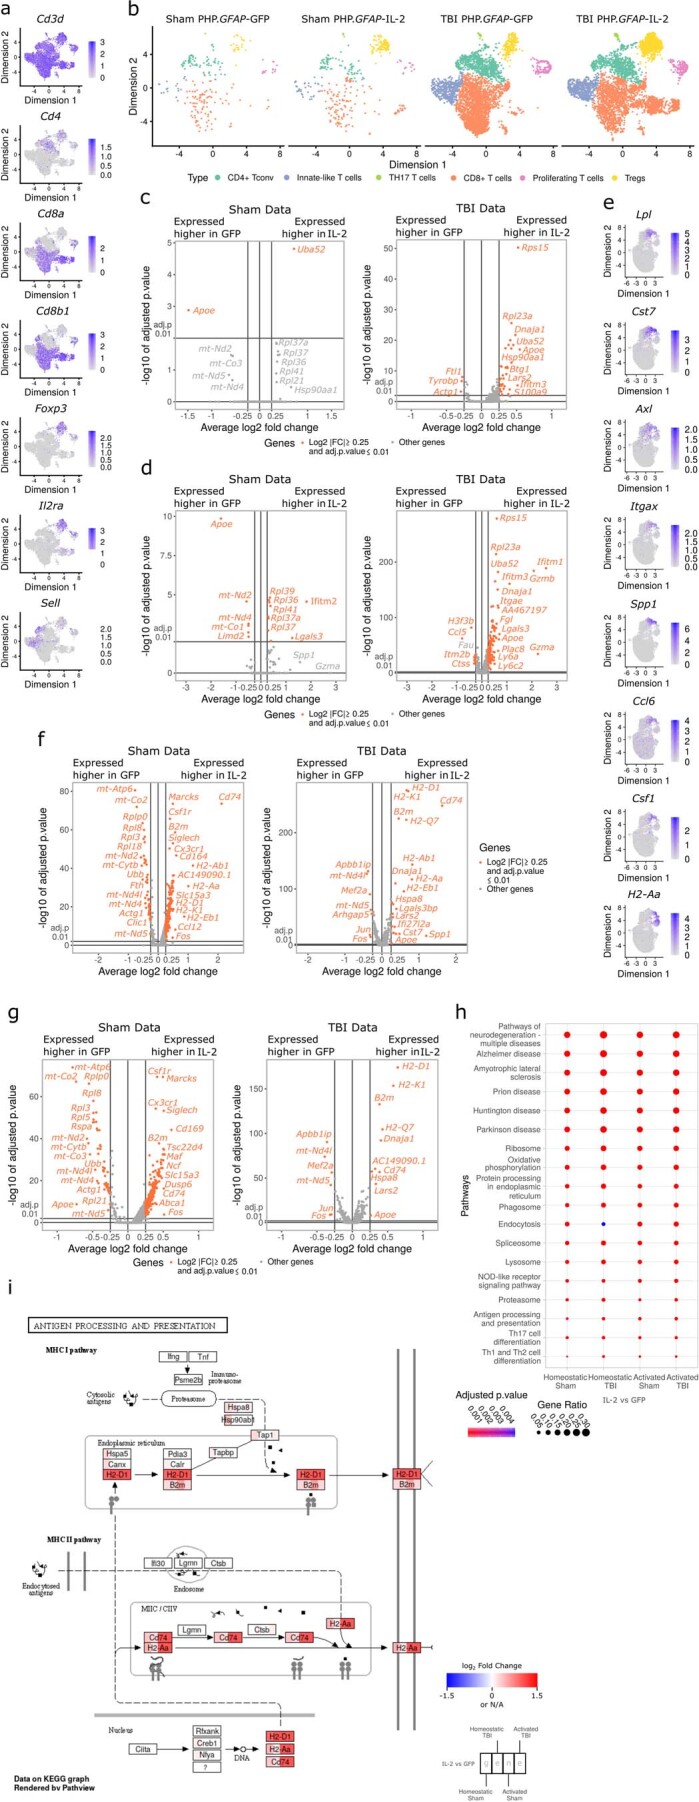
Extended Data Fig. 10. Transcriptional analysis following brain-specific delivery of IL-2 during TBI.

Wildtype mice, treated with PHP.GFAP-IL-2 (or PHP.GFAP-GFP control vector) on day -14 were given controlled cortical impacts to induce moderate TBI or sham surgery. 14 days post-TBI, T cells and microglia were sorted from the perfused brains for 10x single-cell transcriptomics. a, UMAP expression plot of T cell data, with expression patterns of CD3d, CD4, CD8, Foxp3, IL-2RA and Sel1 superimposed to identify various T cell populations. b, T cell UMAP representation, showing the relative numbers of various T cell types across treatment groups. c, Volcano plot showing differential gene expression in the CD4 Tconv cluster between PHP.GFAP-GFP and PHP.GFAP-IL-2-treated mice, for sham (left) and TBI (right). d, Volcano plot showing differential gene expression in the CD8 T cell cluster between PHP.GFAP-GFP and PHP.GFAP-IL-2-treated mice, for sham (left) and TBI (right). e, UMAP expression plot of microglia data, with differential expression patterns of Lpl, Cst7, Axl, Itgax, Spp1, Ccl6, Csf1 and H2-Aa shown. f, Volcano plot showing differential gene expression for total microglia between PHP.GFAP-GFP and PHP.GFAP-IL-2-treated mice, for sham (left) and TBI (right). g, Volcano plot showing differential gene expression for homeostatic microglia between PHP.GFAP-GFP and PHP.GFAP-IL-2-treated mice, for sham (left) and TBI (right). h, Filtered overview of KEGG pathways based on differential gene enrichment in microglia from PHP.GFAP-GFP and PHP.GFAP-IL-2-treated mice, for sham and TBI conditions. i, Pathview plot for ‘Antigen processing and presentation’ (KEGG mmu04612), using the average log-fold changes between the four differential gene expression comparisons indicated. n = 3/group for TBI and n = 1/group for sham. Statistical analyses were performed using negative binomial test for differential expression, using the standard analysis pipeline in Seurat (f, g).
