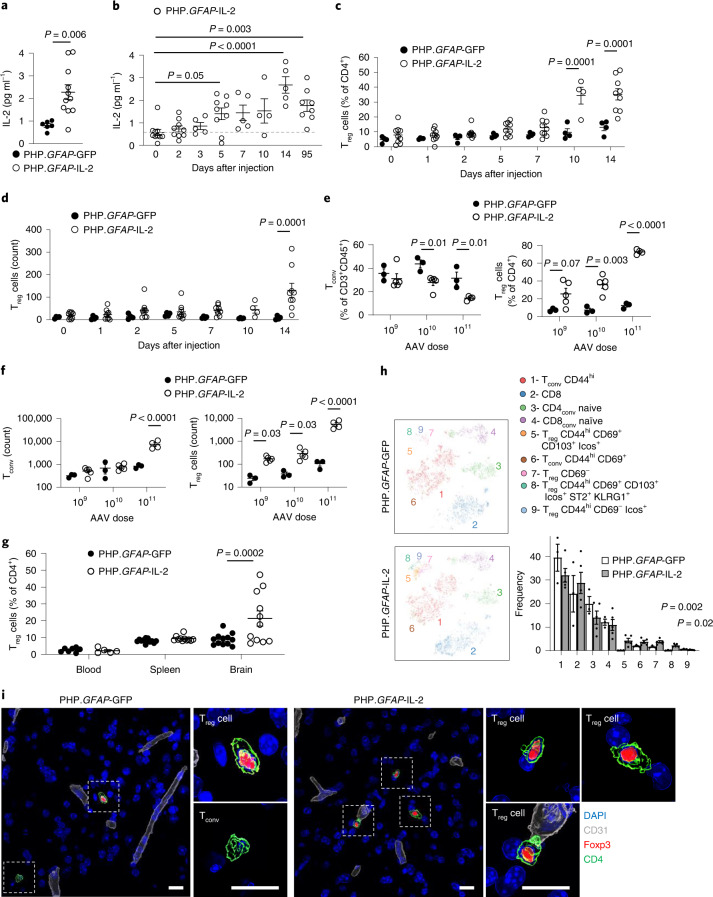
Fig. 4. Dual-lock delivery of IL-2 to the brain expands local Treg cells.
a, IL-2 levels detected by ELISA in the brains of wild-type mice, 14 d after treatment with PHP.GFAP-GFP or PHP.GFAP-IL-2 (n = 6, 11). b, Time course of IL-2 levels in the brains of mice treated with PHP.GFAP-IL-2 (n = 10, 9, 5, 9, 5, 4, 5 and 8). c,d, Time course of Treg cell expansion, as a proportion (c) or absolute number (d) of CD4+ T cells in the brains of mice treated with PHP.GFAP-GFP or PHP.GFAP-IL-2 (n = 4, 9). e, Wild-type mice were administered 1 × 10⁹ (n = 3, 5), 1 × 10¹⁰ (n = 3, 5) or 1 × 10¹¹ (n = 3, 4) vector genomes (total dose) of PHP.GFAP-GFP or PHP.GFAP-IL-2 by intravenous injection and assessed for the frequency (e) or absolute number (f) of conventional T cells (left) and Treg cells (right) in the perfused brain 14 d after treatment (n = 3, 5 for the 1 × 10⁹ and 1 × 10¹⁰ groups; n = 3, 4 for the 1 × 10¹¹ group). g, Blood, spleens and perfused mouse brains from PHP.GFAP-GFP- and PHP.GFAP-IL-2-treated mice were compared by high-dimensional flow cytometry for Treg cell numbers (n = 7, 5 blood; n = 12, 11 spleen and brain). h, t-SNE of CD45+CD11b−CD19−CD3+ T cells built on key markers (CD4, CD8, Foxp3, CD62L, CD44, CD103, CD69, CD25, PD-1, Nrp1, ICOS, KLRG1, ST2, Ki67, Helios and CTLA4) from perfused brains. Colors indicate annotated FlowSOM clusters; results are quantified in the bar graph (n = 3, 5). Mean ± s.e.m. i, Representative images (surface-rendered confocal sections) of Treg cells in the midbrain of PHP.GFAP-GFP and PHP.GFAP-IL-2-treated mice. A representative picture of three individual mouse samples is shown. Scale bar, 10 µm. Data from a–h are shown as the mean ± s.e.m. All experiments were repeated independently (≥ twice). Statistical analyses were performed using an unpaired two-tailed Student’s t-test (a and h), one-way ANOVA with Dunnett’s multiple-comparisons test (b) or two-way ANOVA with Bonferroni correction (c–g).

