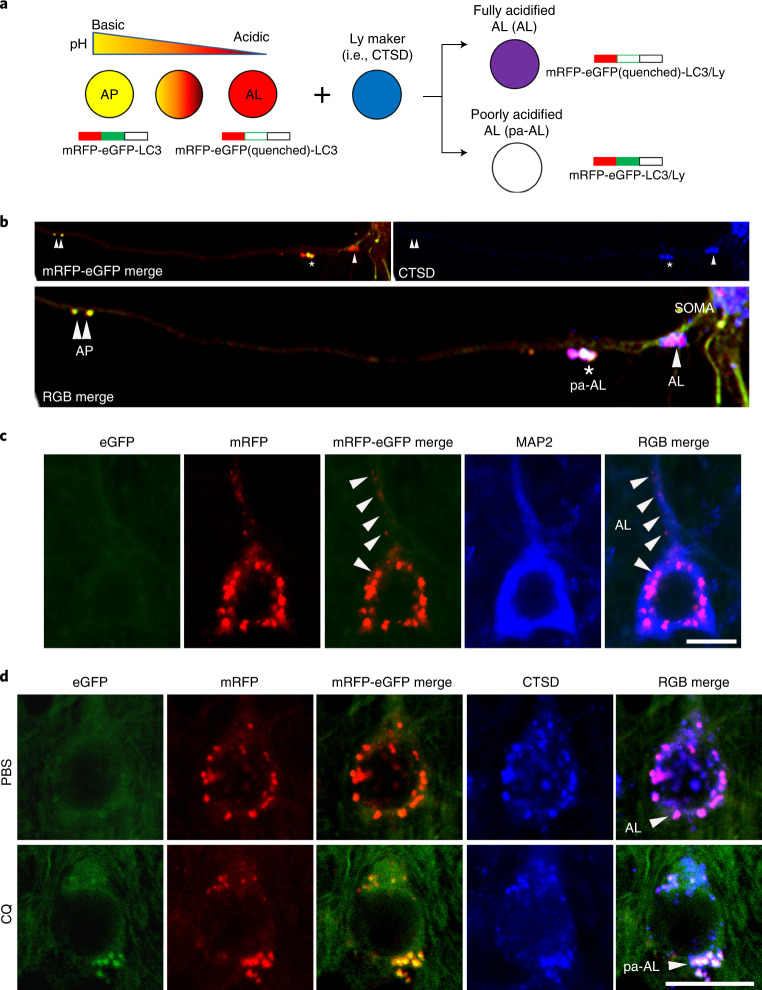
Fig. 1. Design and expression of dual-tagged autophagy sensor in TRGL mouse brain.
a, Schematic representation of the tfLC3 color change. The sensor is composed of pH-resistant mRFP, pH-sensitive eGFP and LC3. An acidic environment triggers the quenching of the eGFP signal, resulting in the conversion of net yellow signal to red-only signal. In combination with LY marker (pseudo-blue), fully acidified AL (AL) or poorly acidified AL (pa-AL) produce purple or white color, respectively. b, tfLC3 fluorescence change in primary neurons. APs (double arrowheads) were seen at distal levels of axons, and pa-ALs (asterisk) were seen at more proximal levels, whereas fully acidified ALs (arrowhead) were predominantly located near or in the perikaryon. c, Representative fluorescence images from neocortical layer V neurons of TRGL mice co-labeled with the cytoskeleton marker MAP2. Arrowhead denotes fully acidified AL (AL). Scale bar, 10 μm. d, Representative fluorescence images of the tfLC3 fluorescence change under lysosomal acidification altered conditions (CQ) in TRGL mouse brain. Arrowheads denote AL or pa-AL. Scale bar, 20 μm. b–d, Experiment was repeated three times independently with similar results.

