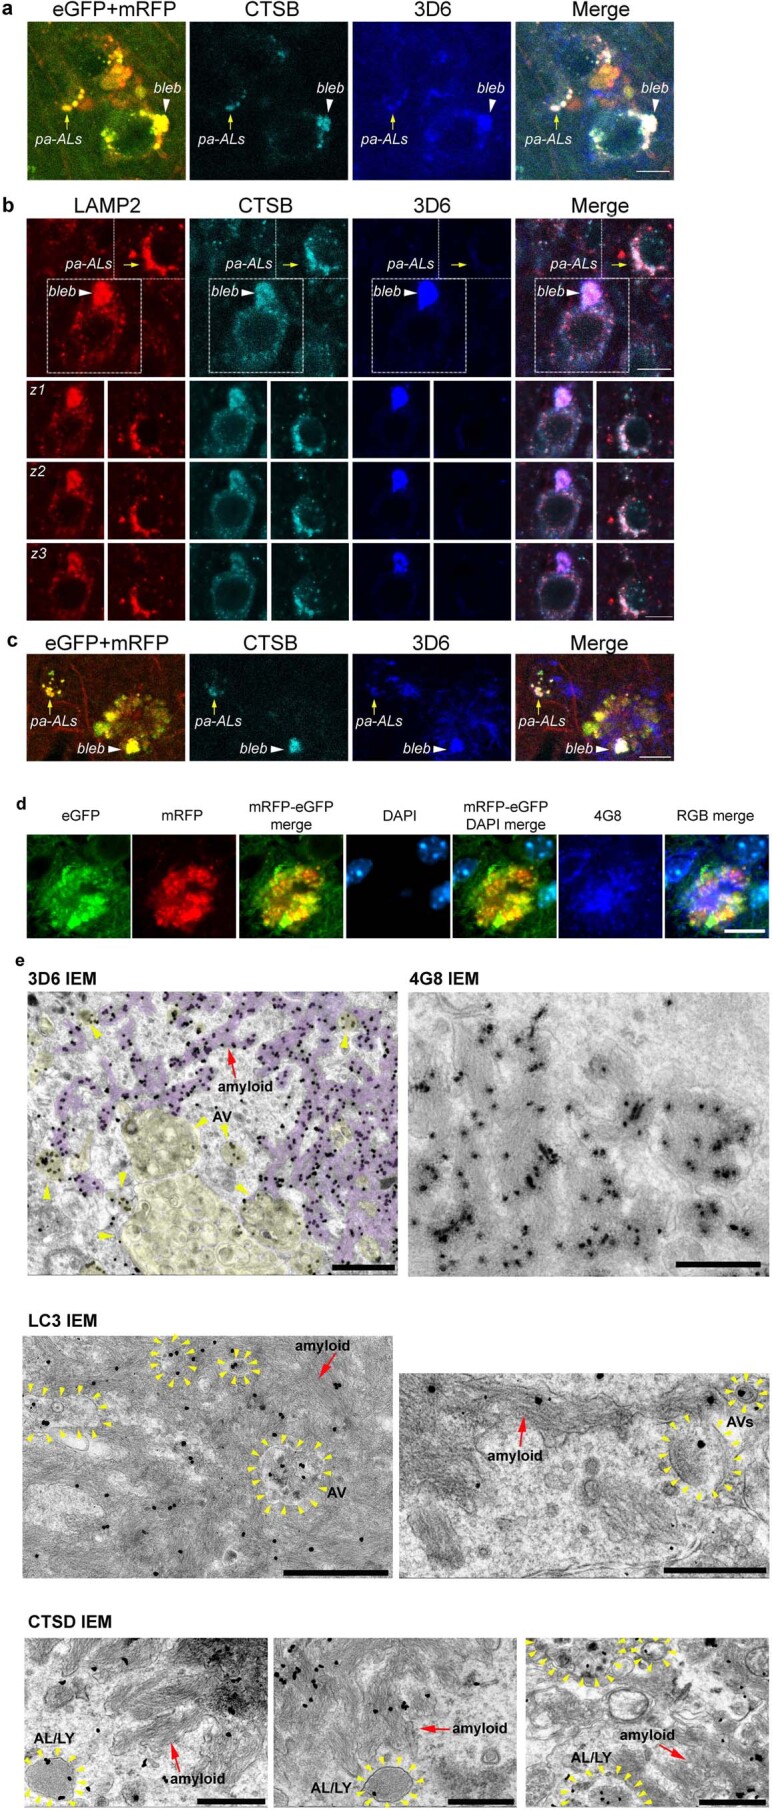
Extended Data Fig. 6. The progression of PANTHOS formation in relation to amyloid in AD mouse model brains and amyloid fiber network IEM characterization.

a. IHF labeling of 28-month-old APP51/TRGL layer V cortical neurons with LY marker (CTSB) and 3D6 monoclonal antibody against APP-βCTF/Aβ. Representative plane from a Z-stack (see also Extended Data Fig. 7a) of an early stage: 3D6 accumulates in CTSB positive perikaryal pa-AL of a normal looking cell (pa-AL, yellow arrow) and in those of a bleb-forming cell (bleb, white arrowhead). Scale bar 10 μm. b. IHF labeling of 30-month-old APP51 layer V cortical neurons with LY membrane marker (LAMP2), CTSB and 3D6. Representative single plane (top panel) and respective Z-stack series (1 mm-thick z1-z3, 2nd to 4th panel) of an intermediate stage: 3D6 accumulates in a LAMP2 and CTSB double-positive bleb originated from the perikaryal protrusion of a degenerating neuron (arrowhead and respective series), as opposed to a 3D6-negative neuron with normal perikaryal morphology (arrow and respective series). Scale bar 10 μm. c. IHF labeling of 28-month-old APP51/TRGL layer V cortical neurons with CTSB and 3D6. Representative IHF image of late stage: 3D6 co-localizes with CTSB in a bleb containing pa-AL of a mature PANTHOS neuron (arrowhead), maintaining a similar spatial segregation of 3D6 and CTSB immunoreactivity as seen in earlier stages (pa-AL). Filamentous/fibrillar 3D6 signal also emanates from the center of the PANTHOS. Scale bar 10 μm. d. IHF labeling of APP-βCTF/Aβ (4G8) in 5-month-old 5xFAD/TRGL mouse brain. Representative IHF image of a late stage PANTHOS neuron with intraneuronal Aβ occupying the central area with a faded/disappeared nuclear-DAPI fluorescence. Scale bar 10 μm. e. Representative amyloid (3D6) (that is, full view images for the one shown in Fig. 6f), amyloid (4G8), AV (LC3), and AL/LY (CTSD) IEM images of 5-month-old 5xFAD/TRGL mouse brain. Yellow arrowheads denote AVs and red arrows denote amyloid bundles. Scale bar 1 μm (3D6, CTSD) and 500 nm (LC3). a-e: Experiment was repeated 3 times independently with similar results.
