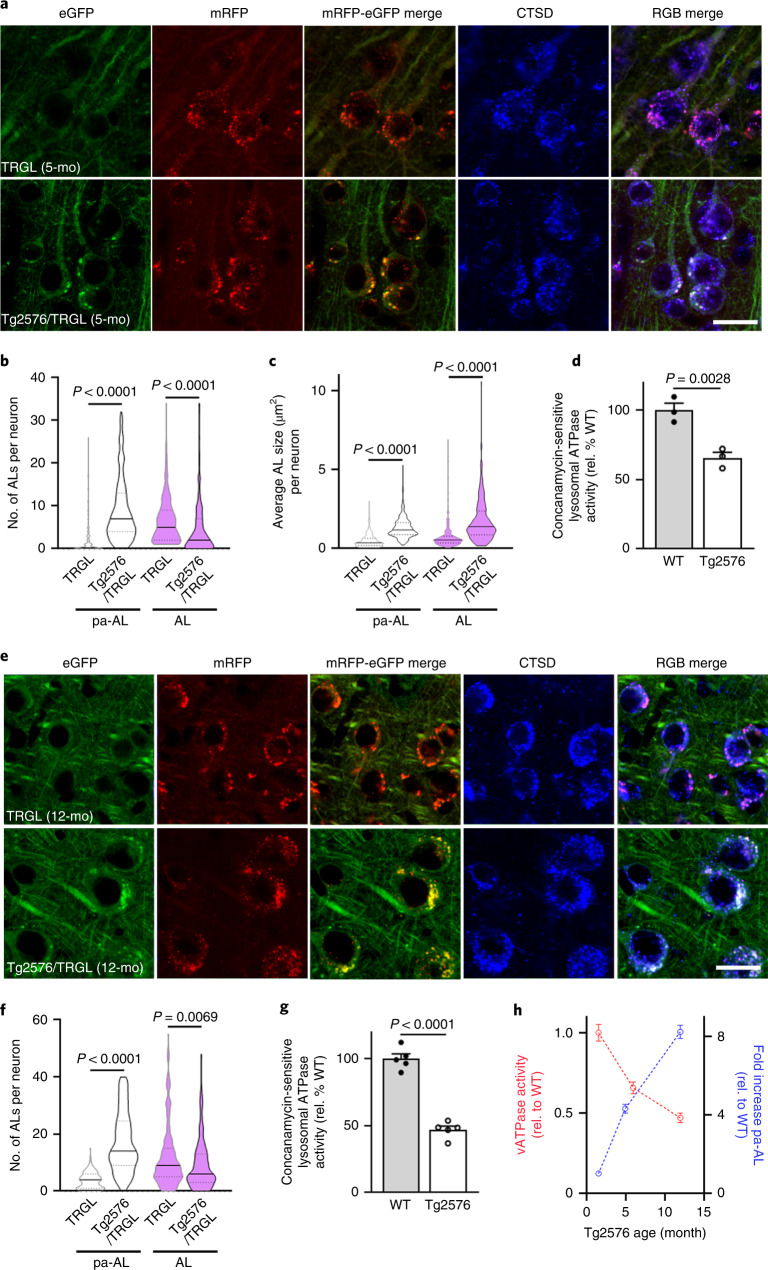
Fig. 2. AL acidification deficits develop early in AD model mice and progress with age.
a, Representative fluorescence images of tfLC3, co-labeled with CTSD, in neocortical neurons of 5-month-old TRGL and Tg2576/TRGL mouse brains. ALs exhibit a red or purple color without or with CTSD co-localization, respectively, whereas pa-ALs exhibit a yellow or white signal depending on CTSD co-label, respectively. Scale bar, 20 μm. b, Number of pa-ALs in 5-month-old Tg2576/TRGL is elevated compared to neurons in TRGL littermates. n = 243 (TRGL) and n = 245 (Tg2576/TRGL) neurons from three mice. c, pa-AL size in 5-month-old Tg2576/TRGL are larger than neurons in TRGL littermates. n = 243 (TRGL) and n = 245 (Tg2576/TRGL) neurons from three mice. d, Lysosomal vATPase activity is decreased in 6-month-old male Tg2576 compared to WT littermate neocortex. n = 3 mice. e, Representative fluorescence images of 12-month-old TRGL and Tg2576/TRGL mouse brains. Scale bar, 20 μm. f, Number of pa-ALs in 12-month-old Tg2576/TRGL are elevated compared to TRGL littermate neocortical neurons and to 5-month-old Tg2576/TRGL. n = 202 (TRGL) and n = 213 (Tg2576/TRGL) neurons from three mice. g, Lysosomal vATPase activity is decreased in 12-month-old male Tg2576 compared to WT littermates (and greater than in 6-month-old Tg2576). n = 5 mice. Violin plot colors correspond to the colors of the puncta (white: pa-AL; purple: AL). h, Time course analysis of vATPase activity and pa-AL number in Tg2576 mice. vATPase activity: n = 3 (1.6 months and 5 months) and n = 5 (12 months). pa-AL: n = 243 (1.6 months), n = 245 (5 months) and n = 213 (12 months). Quantitative data are presented as means ± s.e.m., unpaired t-test, two-tailed P value as indicated. a, e, Experiment was repeated three times independently with similar results. See also Extended Data Fig. 1. mo, month; rel., relative.

