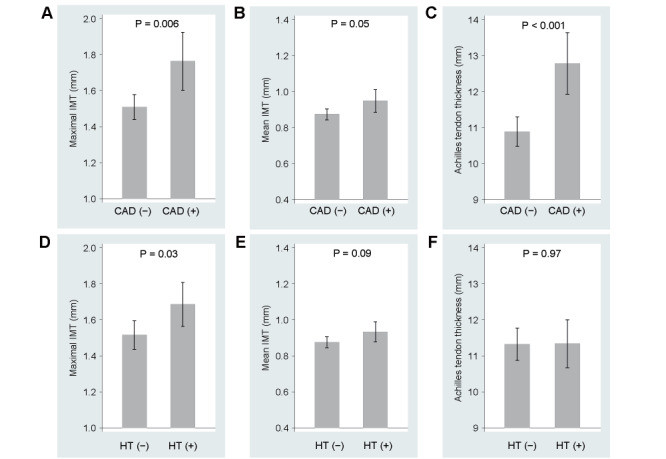
Fig.2. Maximal and mean IMT and Achilles tendon thickness according to prevalent CAD (A-C) and hypertension (HT) (D-F).

Presented are adjusted means (shaded bars) and 95% confidence intervals (vertical bars) derived from the multiple regression analyses.
