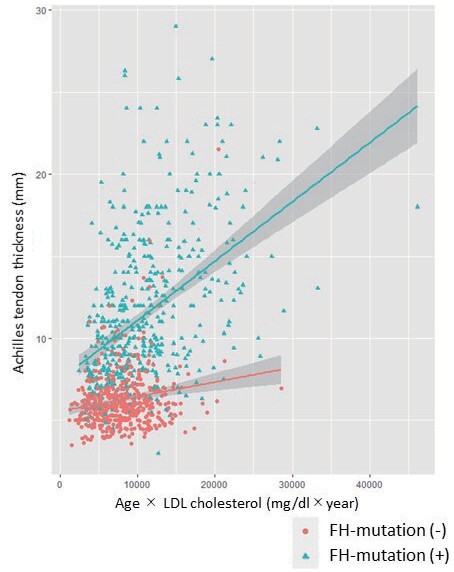
Fig.6. Correlation between age×LDL cholesterol and ATT.

X-axis represents age×LDL cholesterol. Y-axis represents ATT. Green triangles indicate patients with FH-mutation. Red circles indicate patients without FH-mutation.

X-axis represents age×LDL cholesterol. Y-axis represents ATT. Green triangles indicate patients with FH-mutation. Red circles indicate patients without FH-mutation.