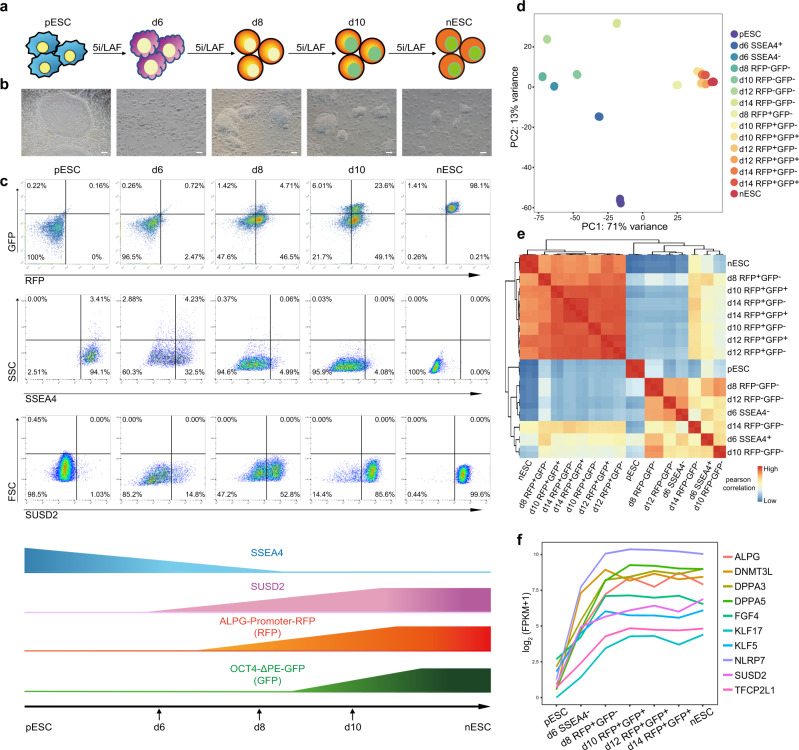
Fig. 1. Transcriptional roadmaps for intermediates with fluorescence dynamics during the primed-to-naive transition process.
a Schematic representation of the primed-to-naive transition using 5iLAF culture conditions. b Morphological changes of cells during the primed-to-naive transition. Scale bars, 50 μm. Representative images from n = 5. c Dynamics of SSEA4, SUSD2, ALPG-promoter-RFP21, and OCT4-ΔPE-GFP12 signals during the primed-to-naive transition process as determined by flow cytometry analysis. d PCA analysis of the bulk RNA-seq datasets collected from the primed-to-naive transition process. n ≥ 2. e Heatmap to indicate the Pearson correlation coefficients among bulk RNA-seq datasets. f Line plots showing the dynamics of representative naive-specific gene expression during the primed-to-naive transition. Source data are provided as a Source Data file.

