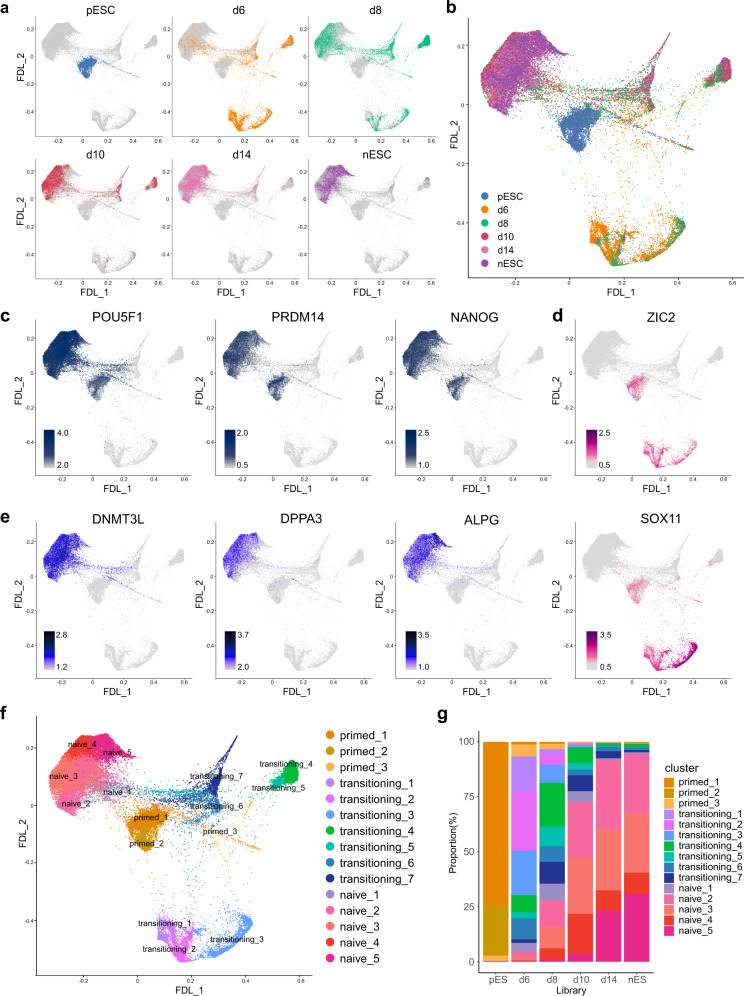
Fig. 2. Single-cell transcriptome profiling during the primed-to-naive transition.
a FDL highlighting cells within each time point or library. b FDL of the integrated scRNA-seq datasets (a total of 38,036 cells) with different libraries highlighted. c–e Expression of marker genes associated with shared pluripotency, POU5F1, PRDM14, NANOG (c, gray-blue); primed pluripotency,ZIC2, SOX11 (d, pink); naive pluripotency, DNMT3L, DPPA3, ALPG (e, blue) on FDL. f Cell clustering projection on FDL dimensionality reduction, total 15 clusters. g Bar plot showing cell clusters proportions of different libraries in (f). Source data are provided as a Source Data file.

