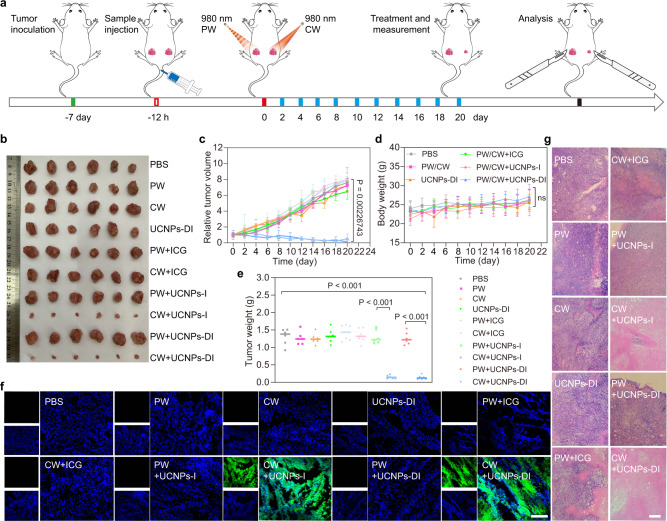
Fig. 6. Orthogonally regulated tumor photo-treatment.
a Schematic illustration of the PDT treatment regimen. b Photographs of tumor tissues extracted from the mice that received a set of treatments at 21 days including PBS, PW, CW, UCNPs-DI, PW + ICG, CW + ICG, PW + UCNPs-I, CW + UCNPs-I, PW + UCNPs-DI, and CW + UCNPs-DI. Relative tumor volume growth curve (c), mice body weight (d), and tumor weight (e) of the mice treated with different treatments. f SOSG immunofluorescence sections treated in series of groups. Scale bar, 100 μm. g H&E staining of tumor slices for treatments. Scale bar, 100 μm. All quantitative data in (c–e) are expressed as mean ± SD (n = 6, biologically independent mice). P values were calculated by Student’s two-sided t-test (nsP > 0.05).

