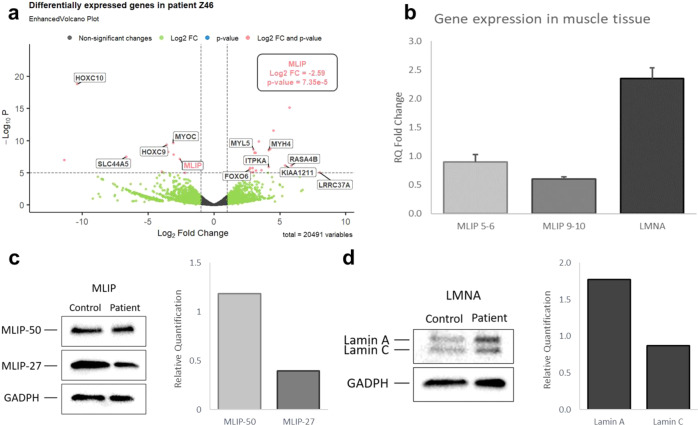
Fig. 1. MLIP and LMNA respective expression in muscular tissue.
a Volcano Plot highlighting the most differentially expressed genes in Z46 compared to controls following DESeq analysis. b RT-qPCR reveals mRNA expression levels for the targeted genes: MLIP 5–6 accounts specifically for transcripts containing the nonsense mutation, MLIP 9–10 covers all the known transcripts, and LMNA probe accounts for both lamin A and C. RPS29 is used for data normalization, error bars correspond to standard deviation (triplicata). c, d Western Blot analysis reveals the presence of four isoforms of MLIP, two of which can be quantified (27 kDa and 50 kDa). Both lamin types also appear for LMNA and were analyzed separately. GAPDH is used as the reference gene for normalization of the blot in both instances.

