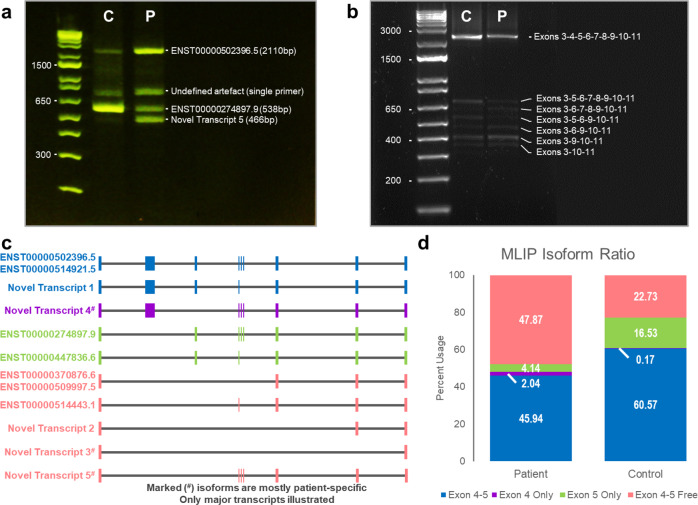
Fig. 2. Evaluation of nonsense variant effect on transcript balance of MLIP.
a Migration of RT-PCR products on 2% E-gel following amplification between exons 3 and 8. 1 Kb Plus E-gel DNA ladder was used for determination of fragment lengths. P = patient, C = Control. b Qualitative visualization of 100 ng of sequencing library on a 1% agarose gel with GelRed revealing agent. Migration was done prior to the end prep step, and 1 Kb Plus DNA Ladder served for amplicons length evaluation. c Visual representation of major (high confidence) muscle transcripts identified with LRS data. Corresponding annotated transcripts are identified (exons 3-11), and all isoforms are color-coded depending on grouping features. d Representation of the samples’ relative transcripts balance, grouped by relevant features. Isoform quantification was performed by FLAIR, and final data contains 82.9k (patient) and 52.3k (control) reads.

