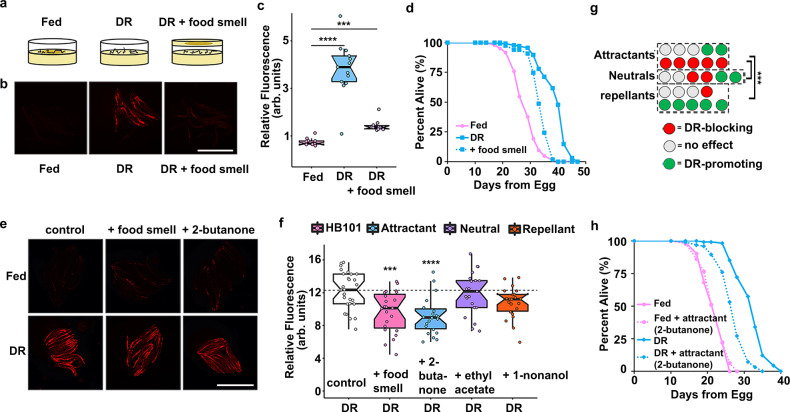
Fig. 1. Attractive food smell blocks dietary restriction-mediated fmo-2 induction and longevity.
Diagram of “smell plates” (a). Images (b) and quantification (c) of individual fmo-2p::mCherry worms on fed (pink), DR (blue) and DR + food smell (OP50) (purple). Scale bar, 1 mm. n = 12 (fed), 13 (DR), 10 (DR + food smell) biologically independent animals. p-value = 2.95e-09 (DR vs. fed), 2.14e-06 (DR + food smell vs. fed). Survival curves (d) of N2 (WT) animals fed (pink) or DR (blue) under normal conditions (solid lines) or subjected to the smell of bacteria (dotted line). Images (e) and quantification (f) of individual fmo-2p::mCherry worms on DR plates exposed to food smell (HB101) (pink) or attractive (2-butanone in blue), neutral (ethyl acetate in purple), or repellant (1-nonanol in orange) odorants. Scale bar, 1 mm. n = 28 (DR), 23 (DR + food smell), 22 (DR + 2-butanone), 25 (DR + ethyl acetate), 22 (DR + 1-nonanol) biologically independent animals. p-value = 0.000374 (DR vs. DR + food smell), 1.12e-05 (DR vs. DR + 2-butanone), 0.442 (DR vs. DR + ethyl acetate), 0.9993 (DR vs. DR + 1-nonanone). g Summary of the effects of 26 odorants on fmo-2 induction during DR. Survival curves (h) of N2 (WT) animals fed (pink) or DR (blue) under normal conditions (solid lines) or subjected to attractive odorants (dotted line). ***P < .001, ****P < .0001 when compared to fed (Welch Two Sample t-test, two-sided). The box plots display the median by the middle line of the box. The upper boundary of the box indicates the 75% interquartile range, and the lower boundary indicates the 25% interquartile range.

