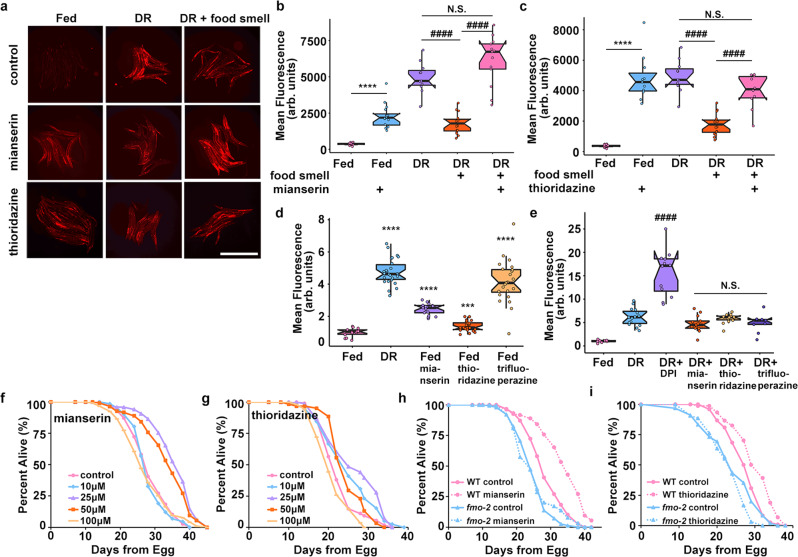
Fig. 2. Serotonin and dopamine antagonists induce fmo-2 and extend lifespan.
Images (a) and quantification of fmo-2p::mCherry given 100 µM of mianserin (b) or thioridazine (c) (blue) in combination with DR and food smell (pink) compared to DR alone (purple). Scale bar, 1 mm. n = 16 (fed), 14 (fed + mianserin), 11 (DR), 16 (DR + food smell), 13 (DR + food smell + mianserin), 11 (fed + thioridazine), 10 (DR + food smell + thioridazine) biologically independent animals. p-value = 3.45e-09 (fed vs. fed + mianserin), 9.77e-10 (DR vs. DR + food smell), 3.34e-10 (DR + food smell vs. DR + food smell + mianserin), 0.0533 (DR vs. DR + food smell + mianserin), 6.42e-12 (fed vs. fed + thioridazine), 2.01e-06 (DR + food smell vs. DR + food smell + thioridazine), 0.0515 (DR vs. DR + food smell + thioridazine). Quantification of Fed, DR, and DR + food smell in b and c are identical as data in b and c were acquired concurrently. Quantification (d) of fmo-2p::mCherry exposed to water (pink), DR (blue), 100 µM mianserin (purple), thioridazine (orange), or trifluoperazine (yellow). n = 18 (fed), 22 (DR), 17 (fed + mianserin), 24 (fed + thioridazine), 24 (fed + trifluoperazine) biologically independent animals. p-value = 1.82e-19 (fed vs. DR), 2.29e-13 (fed vs. fed mianserin), 0.000345 (fed vs. fed thioridazine), 1.73e-10 (fed vs. fed trifluoperazine). Quantification (e) of fmo-2p::mCherry exposed to water (pink) or DR (blue) in combination with 500 µM DPI (purple), 100 µM mianserin (orange), 100 µM thioridazine (yellow), or 100 µM trifluoperazine (dark purple). n = 8 (fed), 15 (DR), 13 (DR + DPI), 13 (DR + mianserin), 14 (DR + thioridazine), 9 (DR + trifluoperazine) biologically independent animals. p-value = 1.69e-06 (DR vs. DR + DPI), 0.0955 (DR vs. DR + mianserin), 0.633 (DR vs. DR + thioridazine), 0.136 (DR vs. DR + trifluoperazine). Survival curves (f) of N2 (WT) animals treated with 0 μM (water; pink), 10 µM (blue), 25 µM (purple), 50 µM (orange), or 100 µM (yellow) mianserin. Survival curves (g) of WT animals treated with 0 μM (water; pink), 10 µM (blue), 25 µM (purple), 50 µM (orange), or 100 µM (yellow) thioridazine. Survival curves (h) of WT animals (pink) and fmo-2 KO animals (blue) on water (solid lines) or 50 µM mianserin (dotted lines). Survival curves (i) of WT animals (pink) and fmo-2 KO animals (blue) on water (solid lines) or 25 µM thioridazine (dotted lines). ***P < .001, ****P < .0001 when compared to fed (Welch Two Sample t-test, two-sided). ####P < .0001 when compared to DR or DR + food smell (Welch Two Sample t-test, two-sided). The box plots display the median by the middle line of the box. The upper boundary of the box indicates the 75% interquartile range, and the lower boundary indicates the 25% interquartile range.

