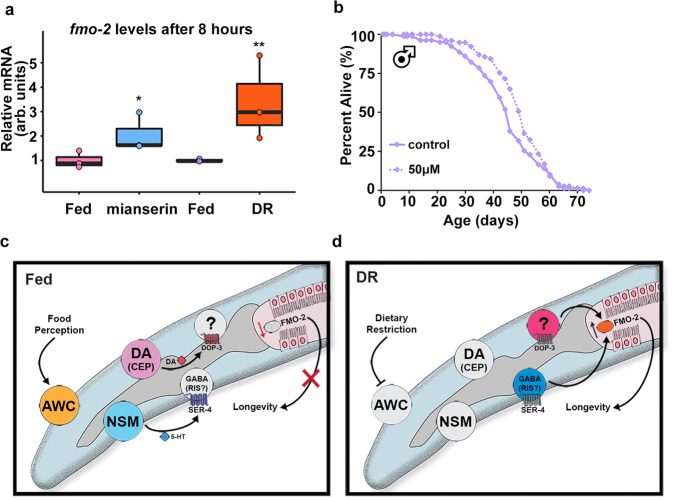
Fig. 5. Serotonin antagonist mianserin induces FMO and improves health in Drosophila.
Fmo-2 mRNA levels (a) after eight hours of 2 mM mianserin (blue) or starvation (orange) compared to water controls (pink and purple, respectively). n = 3 (fed, mianserin, fed, DR) biologically independent experiments. p-value = 0.0365 (fed vs. mianserin), 0.00914 (fed vs. DR). Survival curves of male flies treated with water (solid line) or 50 µM (dotted line) mianserin (b). Panels c and d depict the current model for the cell non-autonomous DR/food odor signaling pathway. “DA” stands for dopaminergic neuron. *P < .05, **P < .01 when compared to control or fed (Welch Two Sample t-test, two-sided). The box plots display the median by the middle line of the box. The upper boundary of the box indicates the 75% interquartile range, and the lower boundary indicates the 25% interquartile range.

