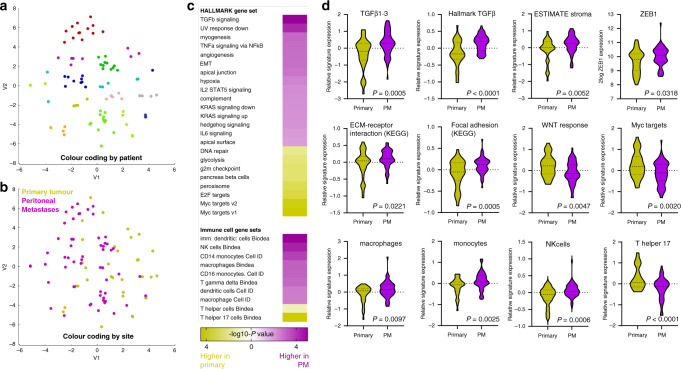
Fig. 1. Molecular analysis of colorectal peritoneal metastases reveals multiple features of aggressive tumour behaviour.
a RNA sequencing of PM (n = 59) and paired primary tumour regions (n = 35) from 12 individual patients was performed. The t-SNE plot shows the clustering of most samples per patient. b The same t-SNE plot colour coded by site (primary versus PM). c Gene set enrichment analyses of all Hallmark signatures (n = 50) and immune cell gene sets (Bindea and Cell-ID). All gene sets that were significantly enriched in either PM or primary tumour samples are shown and ordered by the significance and direction of enrichment. d Examples of box plots of individual gene sets expressed at significantly different levels in either PM or primary tumour samples.

