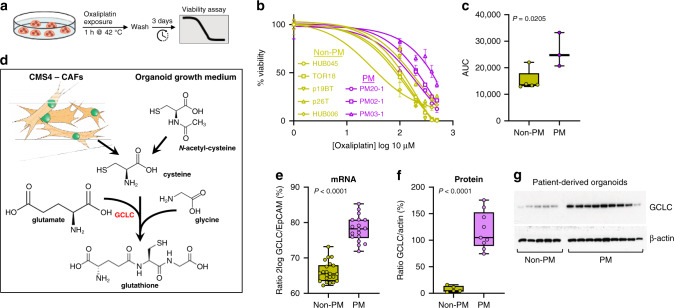
Fig. 3. PM-derived organoids display relative resistance to oxaliplatin and express high levels of glutamate-cysteine ligase (GCLC).
a Schematic representation of the experimental setup. b Dose–response curves for five non-PM CRC-derived organoids and threePM-derived organoids. The dose range of oxaliplatin was 1, 100, 200, 300, 400 and 500 μM. Three days after a 1 h exposure to oxaliplatin the fraction of remaining viable cells was measured using Cell Titer Glo and plotted as percentage of untreated control cells. c Boxplot showing area under the curve (AUC) values, calculated from the dose–response curves. d The contribution of cancer-associated fibroblasts (CAFs) and N-acetyl-cysteine (NAC) in glutathione synthesis. GCLC, the rate-limiting enzyme in this pathway, is indicated in red. e GCLC mRNA expression levels in non-PM and PM-derived organoids, measured by RNA sequencing. f, g GCLC protein expression levels in non-PM and PM-derived organoids in relation to actin. The boxplot in (f) shows optical density measurements of the exposed films in (g), normalised to actin.

