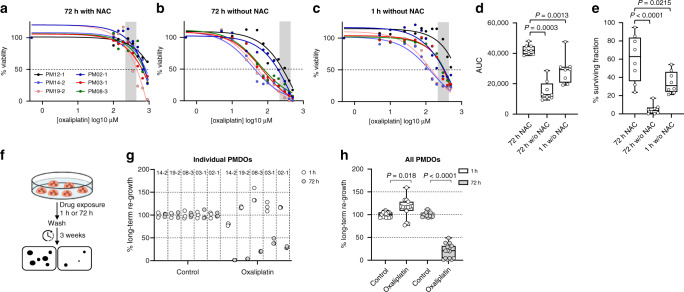
Fig. 4. Depletion of NAC sensitises PM-derived organoids to oxaliplatin.
a–c Drug response curves for a series of six distinct PM-derived organoids treated with oxaliplatin for 72 h in the presence (a) or in the absence of N-acetyl-cysteine (NAC) (b), or treated with oxaliplatin for 1 h in the absence of NAC (c). The range of clinically applied oxaliplatin concentrations in the HIPEC perfusate is indicated by the grey area (215–439 μM). d Boxplot showing AUC values, calculated from the dose–response curves in (a–c). e Boxplot showing surviving cancer cell fractions calculated from the dose–response curves in (a–c). f Schematic representation of the experimental setup of the long-term regeneration assays. g Dotplot showing a quantification of long-term re-growth potential of five distinct PMDOs after a 1-h or 72-h exposure to oxaliplatin (20 μM). h Boxplot showing the aggregated data from (g).

